
Hi, I’m higashi.
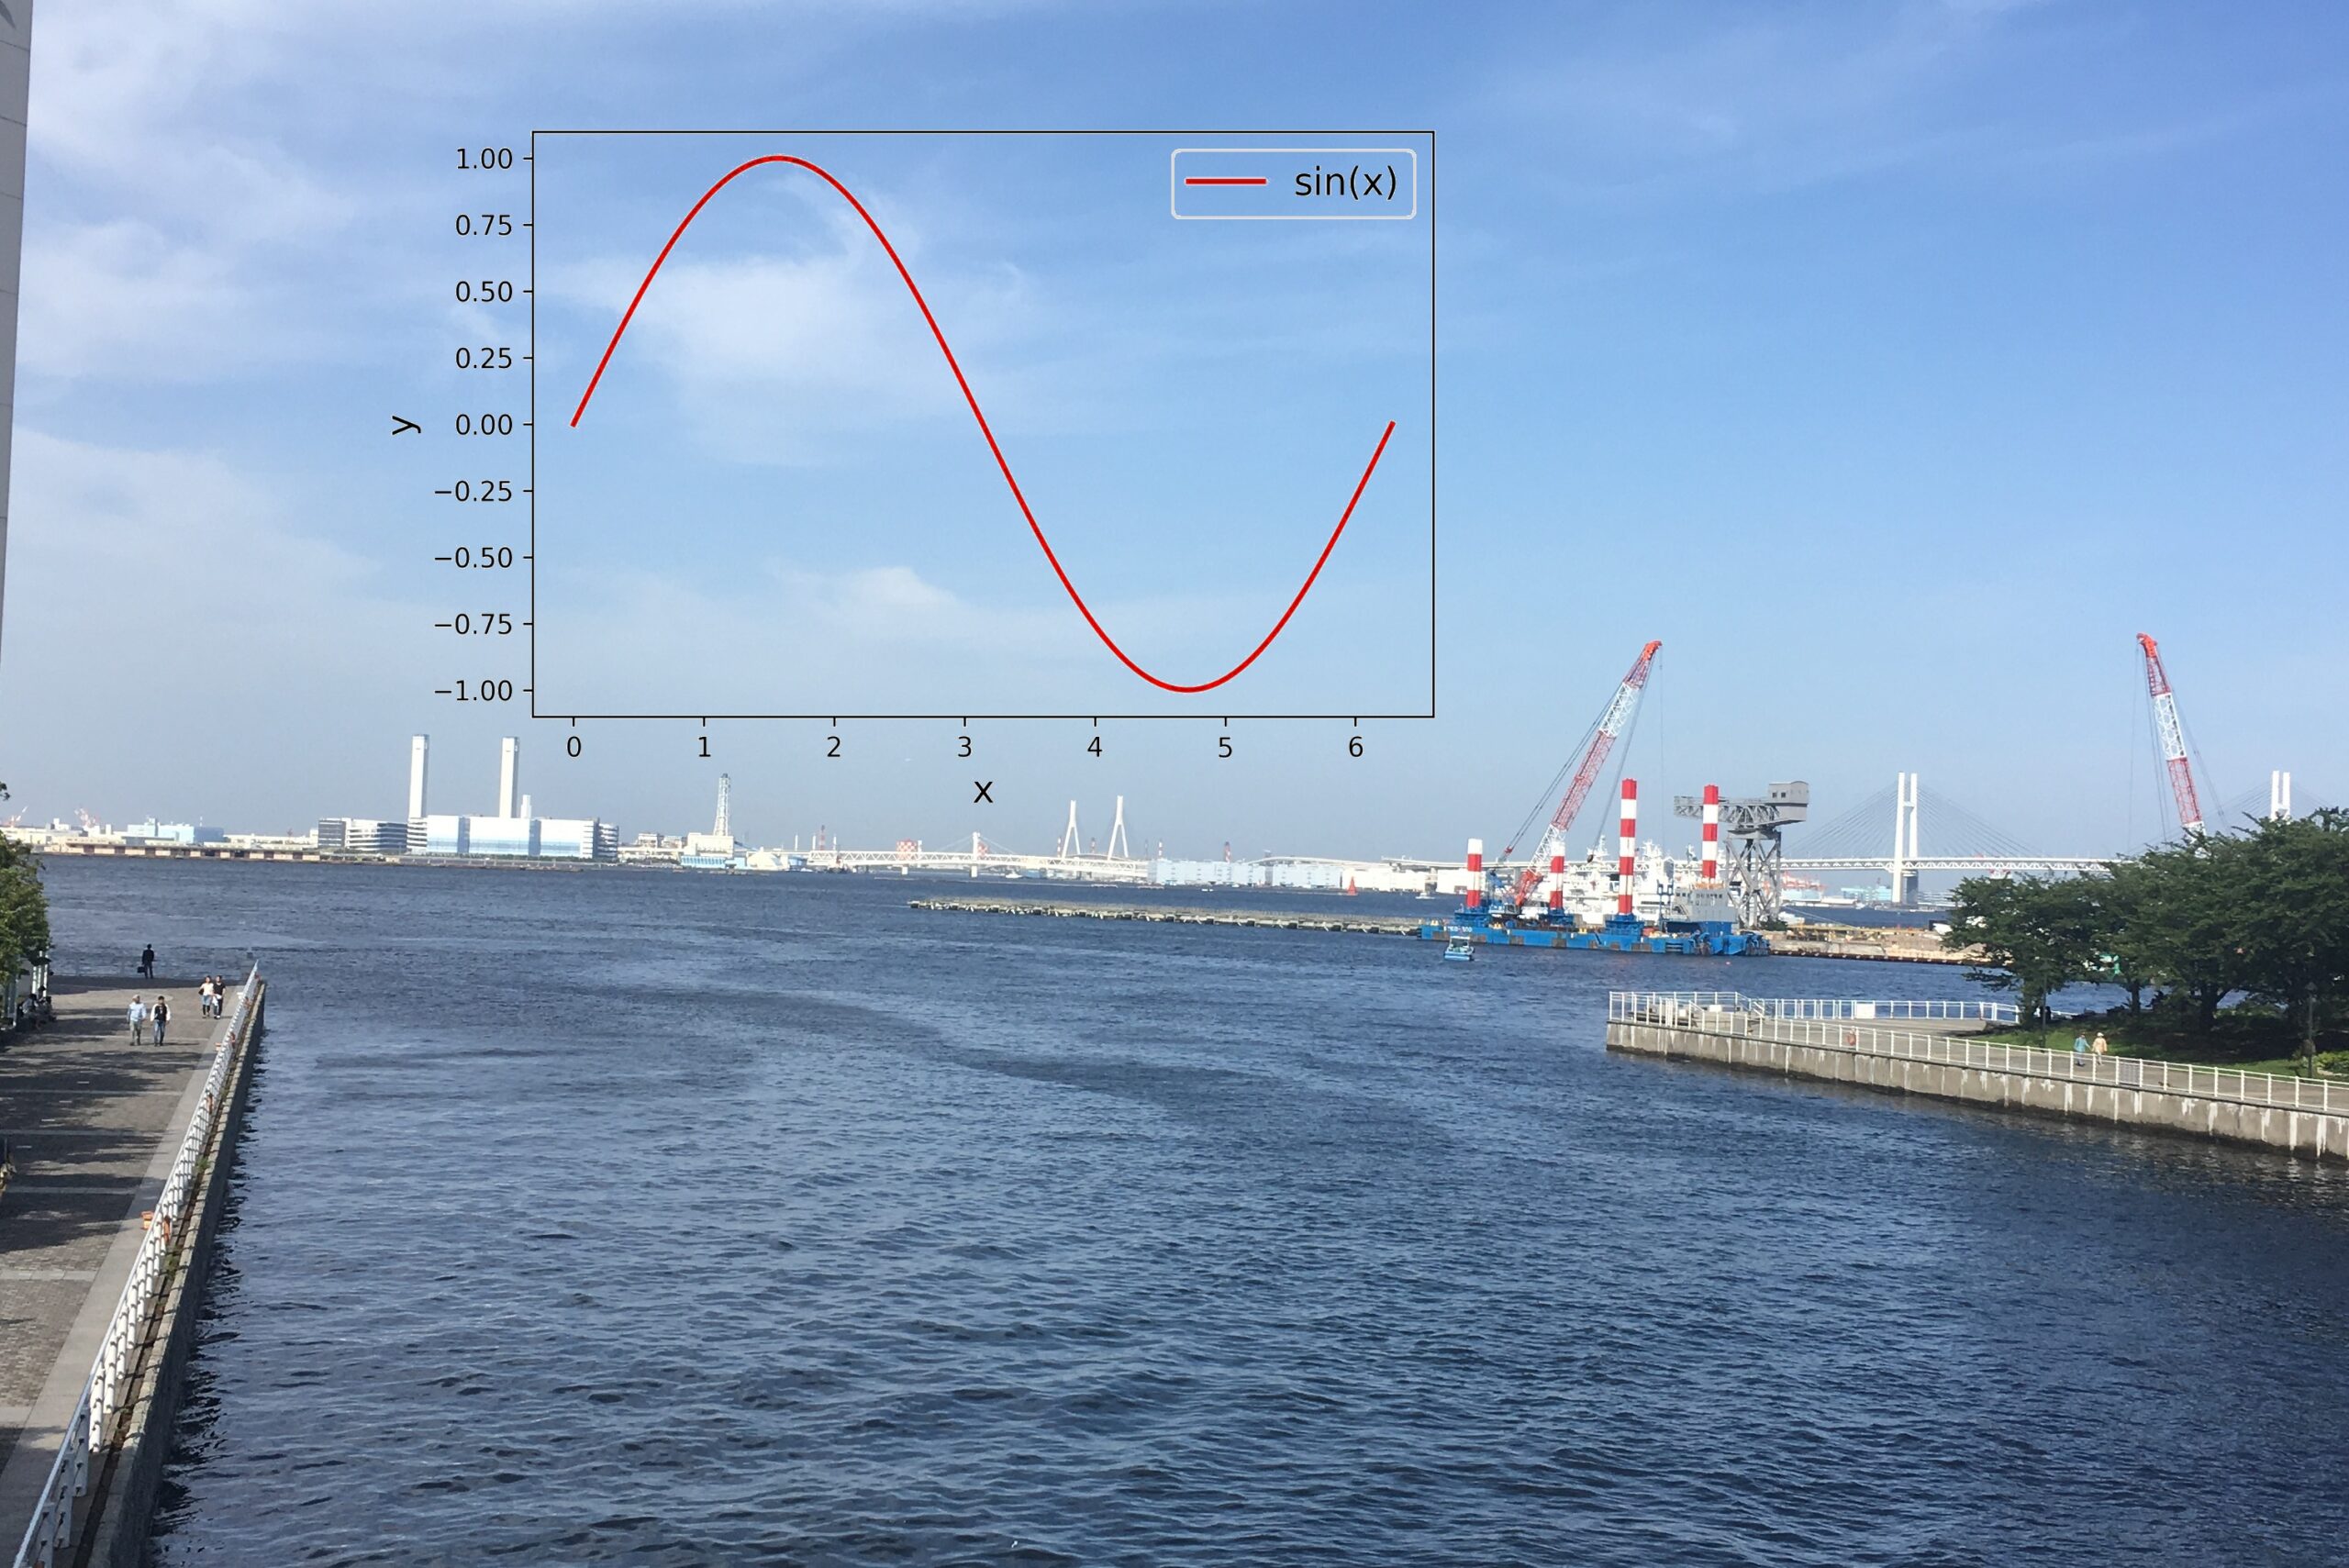
This page introduces how to composite matplotlib’s transparent background graph on image as shown below.
Just you should do is only below.
1.Prepare Base Image
2.Prepare Graph Image
3.Designate the Position and Size of Graph on the Image
4.Conduct the Program Introduced Later
So, let’s get started!!
Introduce of Base Image
In this time, I use the image shown below.
(This is YOKOHAMA in JAPAN)
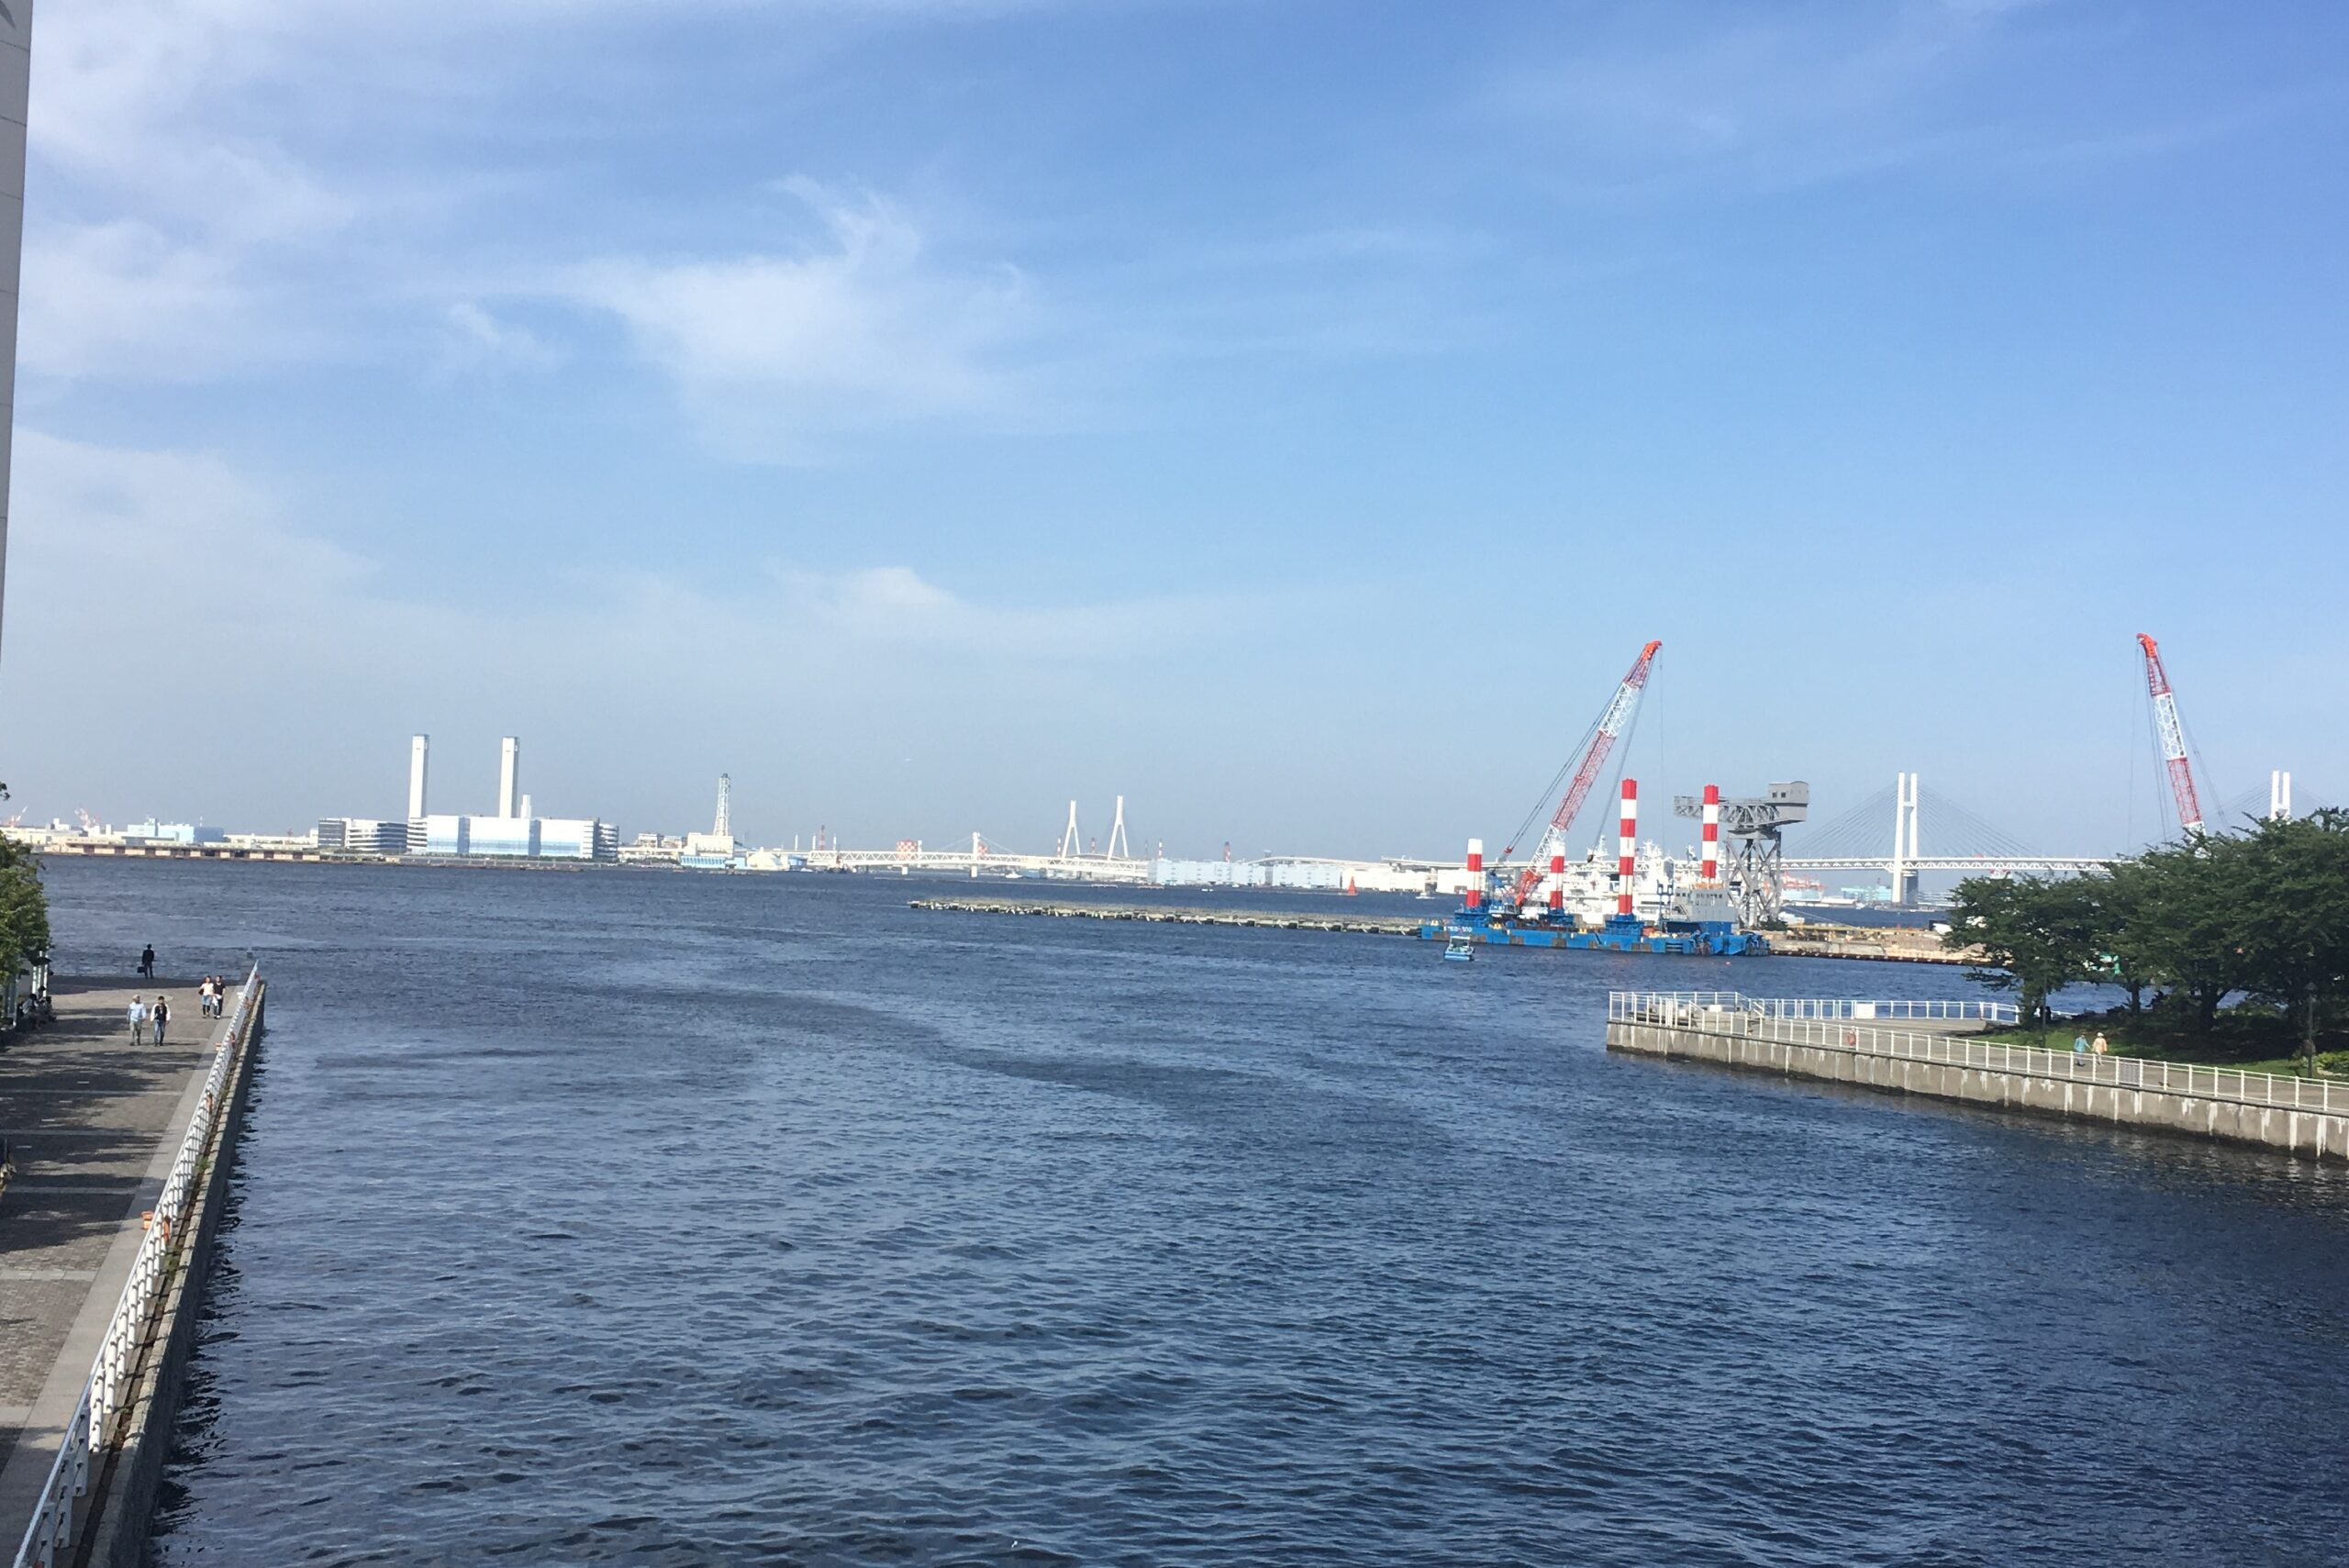
If the resolution of image is too low the graph will be also coarse.
So please prepare high resolution image as possible as you can.
Graph Image Produce Program
To proceed with this work, we need a graph image.
So I make appropriate image by using matplotlib by conducting below program.
import math
import numpy as np
import matplotlib.pyplot as plt
grf_name='grf.jpg'
#make sin data
x=np.linspace(0,2*math.pi,100)
y1=np.sin(x)

#make graph and save image
plt.plot(x,y1,color='red', linestyle='solid', linewidth = 2.0, label='sin(x)')
plt.legend(loc='upper right', fontsize=14)
plt.xlabel('x',color='black',fontsize=14)
plt.ylabel('y',color='black',fontsize=14)
plt.savefig(grf_name, dpi=300)
You will get image on your program conduct directory shown below.
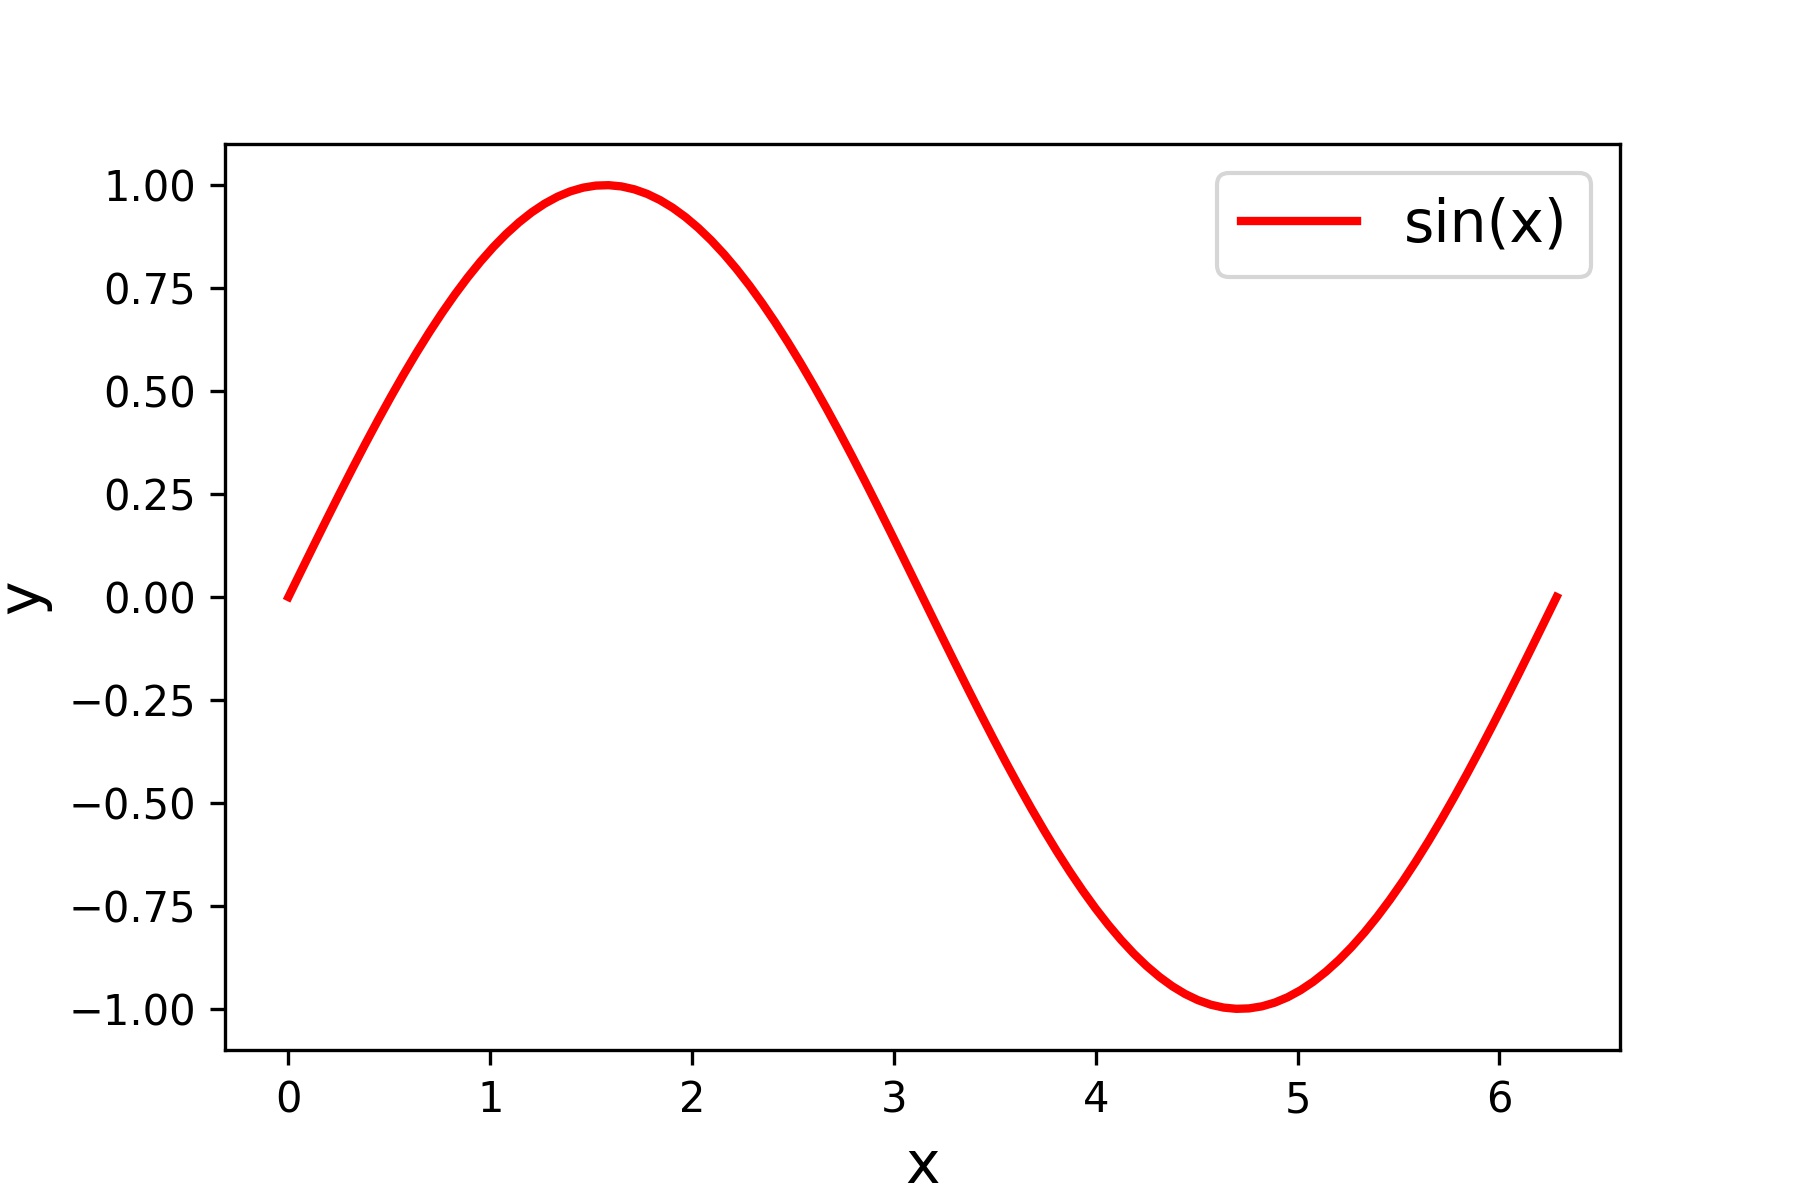
The work introduced later is making this image transparent only the pixel that has white color and composite to base image.
Designate the Position and Size of Graph Image
The program introduced later should designate 4 variables shown below.
mrgh : Pixel number that is right edge of base image from left edge of graph image.
mrgw : Pixel number that is upper edge of base image from upper edge of graph image.
figh : Pixel number of vertical direction of pasted graph image
figw : Pixel number of horizontal direction of pasted graph image
If these value grater than base image, the program will make error.
Sample Code of Compositing Transparent Background Graph
So much for advance preparation, I introduce the program that can composite transparent background graph on image.
#import library
import cv2
import matplotlib.pyplot as plt
import numpy as np
import math

#designate file name
pic_name='sample.jpg'
grf_name='grf.jpg'
fin_name='final.jpg'

#make data for graph image
x=np.linspace(0,2*math.pi,100)
y1=np.sin(x)

#make graph image
plt.plot(x,y1,color='red', linestyle='solid', linewidth = 2.0, label='sin(x)')
plt.legend(loc='upper right', fontsize=14)
plt.xlabel('x',color='black',fontsize=14)
plt.ylabel('y',color='black',fontsize=14)
plt.savefig(grf_name, dpi=300)

#position and size desgnation
mrgh=50
mrgw=500
figh=1000
figw=1500

#process of composite base image and graph image
img=cv2.imread(pic_name,cv2.IMREAD_COLOR)
grf=cv2.imread(grf_name,cv2.IMREAD_COLOR)
grf=cv2.resize(grf,(figw,figh))
#this process conduct the graph transparent
grf[:,:,:]=np.where(grf[:,:,:]>250,img[mrgh:mrgh+figh,mrgw:mrgw+figw,:],grf[:,:,:])
fin=img
fin[mrgh:mrgh+figh,mrgw:mrgw+figw,:]=grf[:,:,:]

#save composite image
cv2.imwrite(fin_name,fin)
Too long program but since I made comment on program, I think you can understand the contents of program.
Confirm the Result of Sample Code
Finally, let’s check the behavior of sample code.
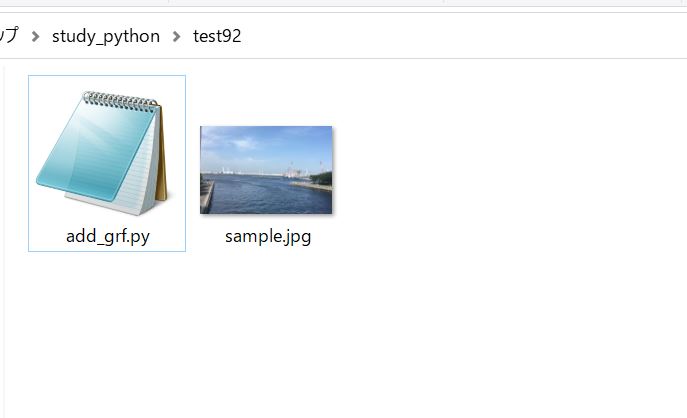
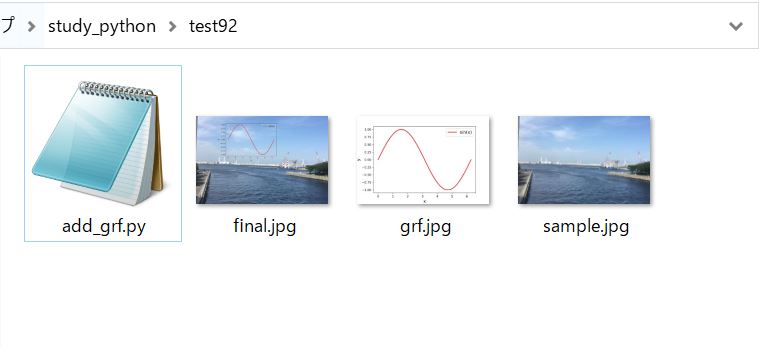
Initial condition of program conducting folder is shown below.
After conducting program, the folder has been changed to shown below.
“final.jpg” is like this as shown at the beginning of this page.
Dotted line graphs can also be used.
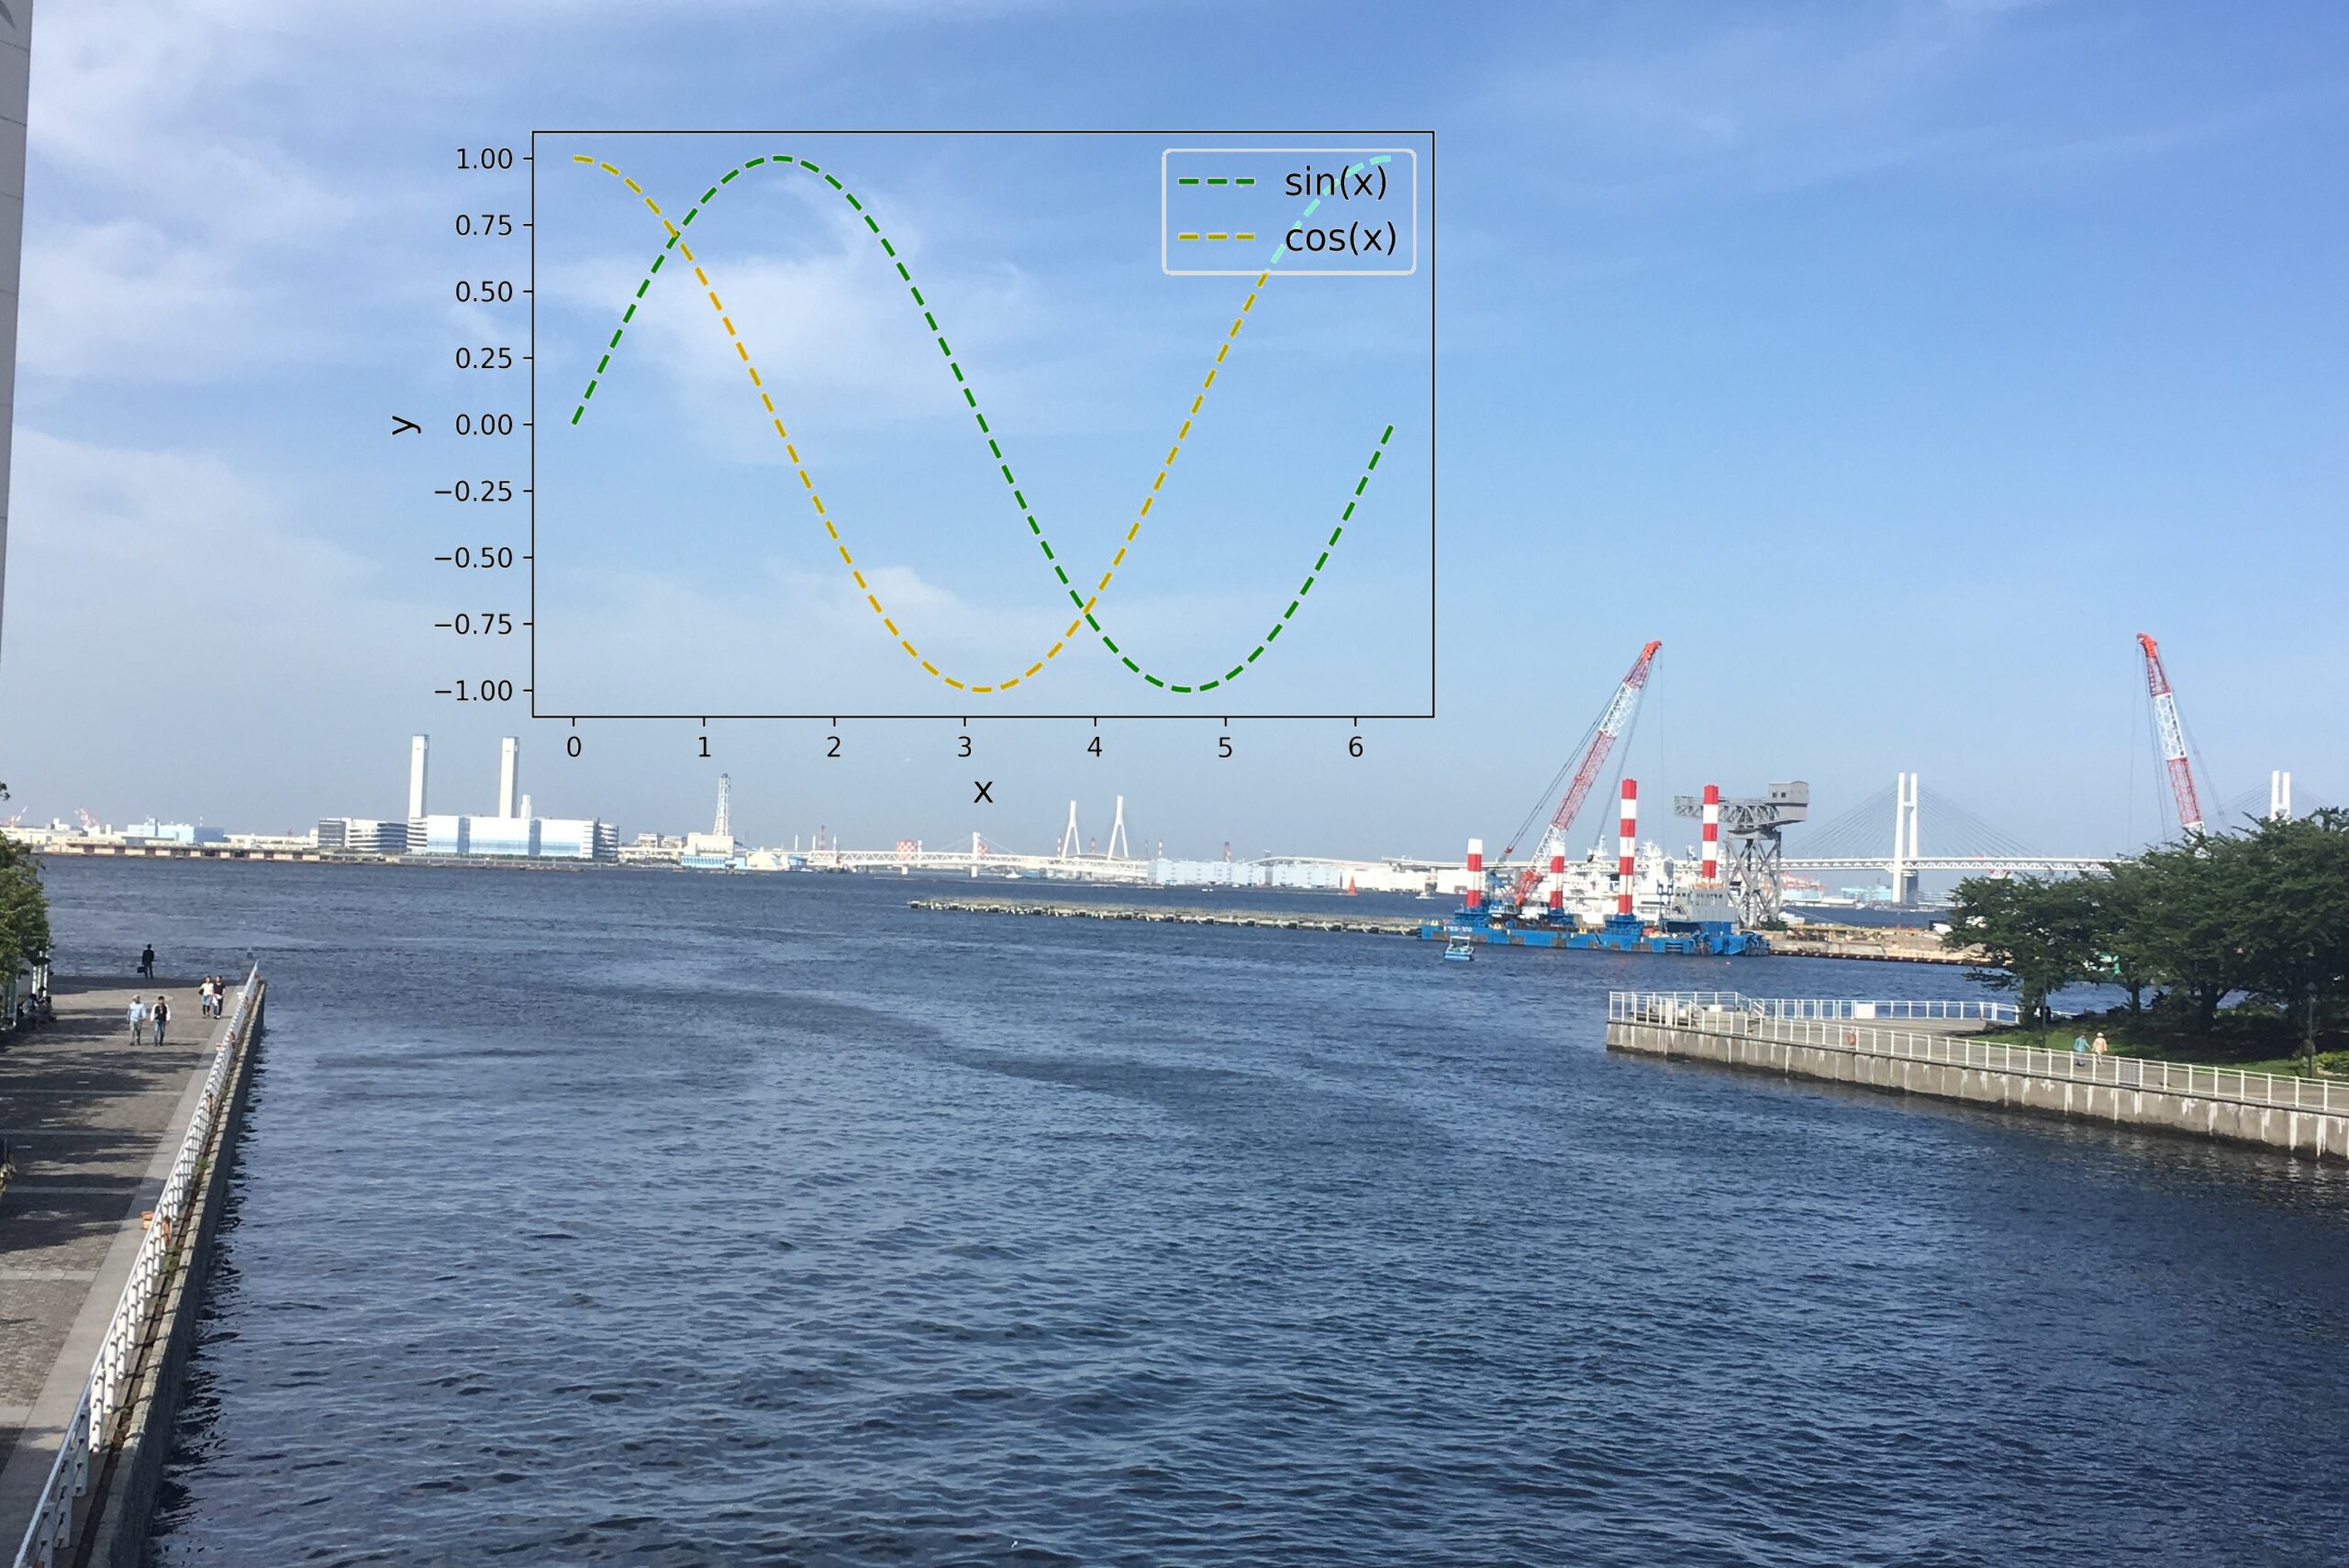
This is very convenient!!
That’ all. Thank you!!


コメント