
Hi, I’m higashi.
This page introduce how to make thinning out data from time series data.
Not only just thinning out but also linear interpolation is also conducted.
This is very useful when I construct AI that can treat time series data such as RNN or LSTM.
So, let’s get started!!
Summary of Data Thinning process
At first I introduce the summary of data thinning out process.
I transpose below data that has fine and uneven time interval to
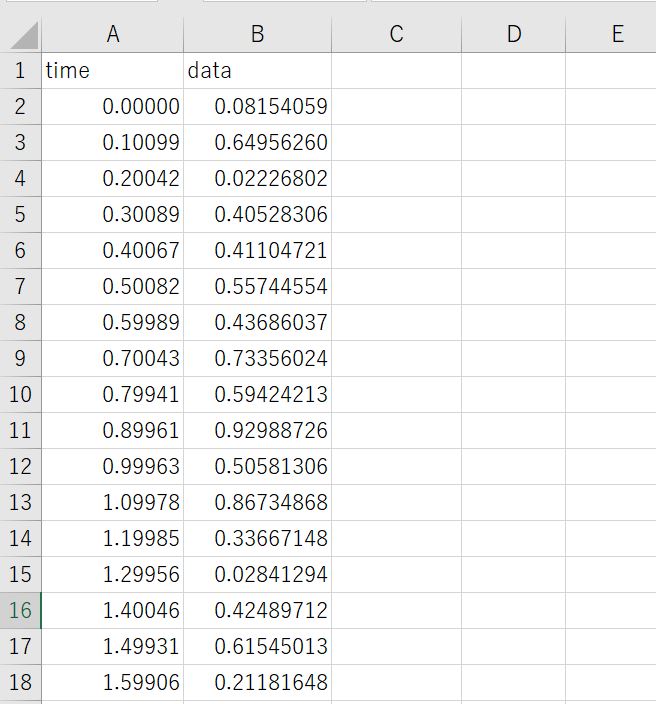
the data that has designated time interval and linearly interpolated as shown below.
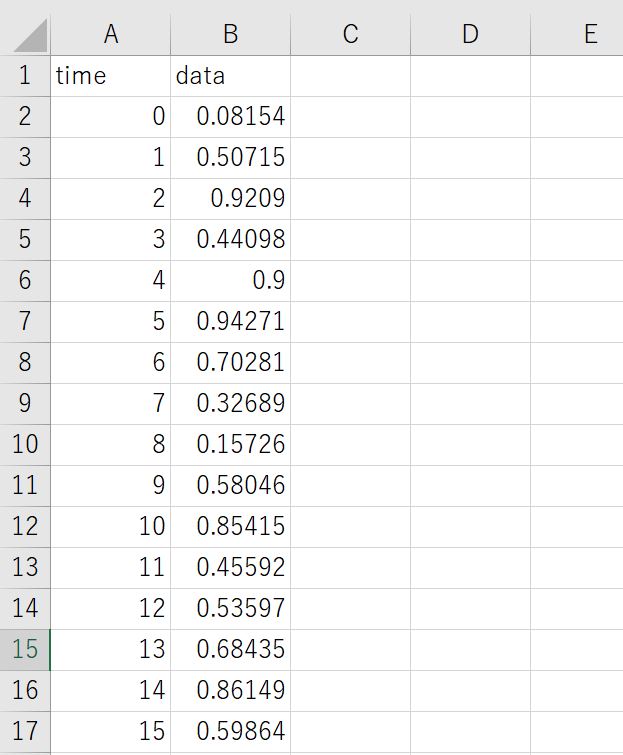
Please check time=0 and 1.
I think you can confirm that has almost same value with before processed.
*Since the data is linearly interpolated, it is not match completely.
If this process is what you want to do, please read continuously.
Necessary Libraries
The sample code that conduct the process introduced before needs below libraries.
〇numpy
〇pandas
〇matplotlib
If you have not installed, please install first.
Sample Program of Data Thinning Out
This program assume there is a csv(sample_data.csv) file that has time series data in the same folder that is this program is saved.
#import library
import pandas as pd
import numpy as np

#input information
file_name='sample_data.csv'
dt=1.0

#read base data
df=pd.read_csv(file_name,header=0)
data=df.values
header=df.columns
file=open('new_data.csv','w')
#process of thinning out
#time=0 is used as it is
new_data=[]
pick_time=dt
file.write(str(header[0])+','+str(header[1])+'\n')
file.write(str(data[0][0])+','+str(data[0][1])+'\n')
new_data.append(data[0])

#conduct linear interpolate at evert dt
for i in range(len(data)):
    if data[i,0]>pick_time:
        x=data[i,0],data[i-1,0]
        y=data[i,1],data[i-1,1]
        a,b=np.polyfit(x,y,1)
        file.write(str(pick_time)+','+str(a*pick_time+b)+'\n')
        new_data.append([pick_time,a*pick_time+b])
        pick_time+=dt
new_data=np.array(new_data)
file.close()
By conducted this program, new data (new_data.csv) that is thinning out data will be created.
And variable “new_data” is array of thinning out data.
Checking the Before and After Processed Data
Finally I check the before and after processed data.
Let’s conduct below program after you did the program introduced before.
#graph processing
import matplotlib.pyplot as plt
plt.scatter(new_data[:,0], new_data[:,1], s=80, c="pink", alpha=0.5, linewidths="2",edgecolors="red")
plt.scatter(data[:,0], data[:,1], s=20, c="blue", alpha=0.5, linewidths="2",edgecolors="black")
plt.xlim(0,10)
plt.grid()
plt.xticks(np.linspace(0,10,11))
plt.show()
Below result is shown.
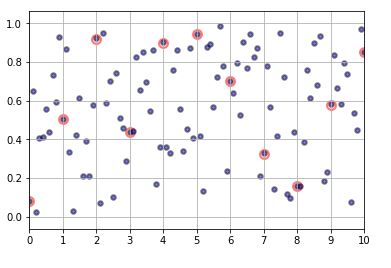
Blue dot means original data, and red data means after thinning out data.
I think you can confirm the program has no problem about data thinning out.
That’s all. Thank you!!


コメント