Hi, this is Higashi.
After saving measurements such as temperature or voltage to a CSV, you often want to plot each signal to see how it changes.
As the number of columns grows, making each chart separately takes more work. And when the temperature changes at a particular moment, you may also want to see what the voltage and current were doing at the same time.
So I made a tool that loads a CSV in the browser, creates a chart for each data column, and keeps their time axes synchronized.
- Load a CSV to display a chart for each column
- CSV files can also have units in the second row
- Zoom in on one chart and the others follow
- Trying it with sample composite signals
- Seeing the synchronized charts in action
- Reading timestamps and missing measurements
- Comparing measurement logs at the same moment
Load a CSV to display a chart for each column
The tool reads the first column as time and the remaining columns as measurement data. The first row contains the name of each column.
For example, you can load a CSV like this.
Time,Temperature,Voltage
0,25.0,12.1
1,25.2,12.0
2,25.5,11.9
The tool displays separate Temperature and Voltage charts, stacked vertically. Both use the time values from the first column for the horizontal axis.
You can choose a file or drag and drop a CSV onto the page.
CSV files can also have units in the second row
CSV files exported by measurement equipment sometimes include a row of units below the column names.
Time,Temperature,Voltage
s,°C,V
0,25.0,12.1
1,25.2,12.0
2,25.5,11.9
In that case, the tool treats row 2 as units and plots the data starting at row 3. The chart titles combine the names and units, such as Temperature [°C] and Voltage [V].
When loading the file, the tool checks whether the time in row 2 can be read as a number or a date and time, and whether the measurement values can be read as numbers. It uses that to decide where the data starts.
The detected starting row appears on screen. If it doesn’t match your file, you can manually select row 2 or row 3 in First data row.
Zoom in on one chart and the others follow
The feature I particularly wanted was synchronized time axes.
Suppose you zoom in on the interval from 5 to 10 seconds in the temperature chart. The voltage and current charts switch to that same interval.
You don’t have to adjust the visible range of each chart separately, which makes comparing measurements at the same time easier.
After zooming, choose Pan to move horizontally and the other charts follow. Reset all time axes returns every chart to its full time range.
Each chart has an independent vertical axis. That lets you examine values with different scales and units, such as temperature and voltage, in their own charts.
Trying it with sample composite signals
For testing, I combined sine and cosine waves. There are 200 time points, from 0 to 19.9 seconds at intervals of 0.1 seconds.
| Signal | Waveform |
|---|---|
| Composite A | A sine wave plus a cosine wave at a different frequency. |
| Composite B | A cosine wave plus a sine wave at a different frequency. |
| Noisy composite signal | A slow sine wave plus a higher-frequency oscillation. |
Here’s the Python code to create the CSV. The column units are placeholders for this test.
import csv
from math import sin, cos

with open(
    "sample_with_units.csv",
    "w",
    newline="",
    encoding="utf-8-sig",
) as file:
    writer = csv.writer(file)

    writer.writerow(["Time", "Composite A", "Composite B", "Noisy composite signal"])
    writer.writerow(["s", "V", "A", "°C"])

    for index in range(200):
        t = index / 10

        signal_a = sin(2 * t) + 0.35 * cos(5 * t)
        signal_b = 2 * cos(t) + 0.6 * sin(3 * t)
        signal_c = 20 + sin(t) + 0.15 * sin(17 * t)

        writer.writerow([t, signal_a, signal_b, signal_c])
The Show sample signals button also displays 200 points generated with the same formulas.
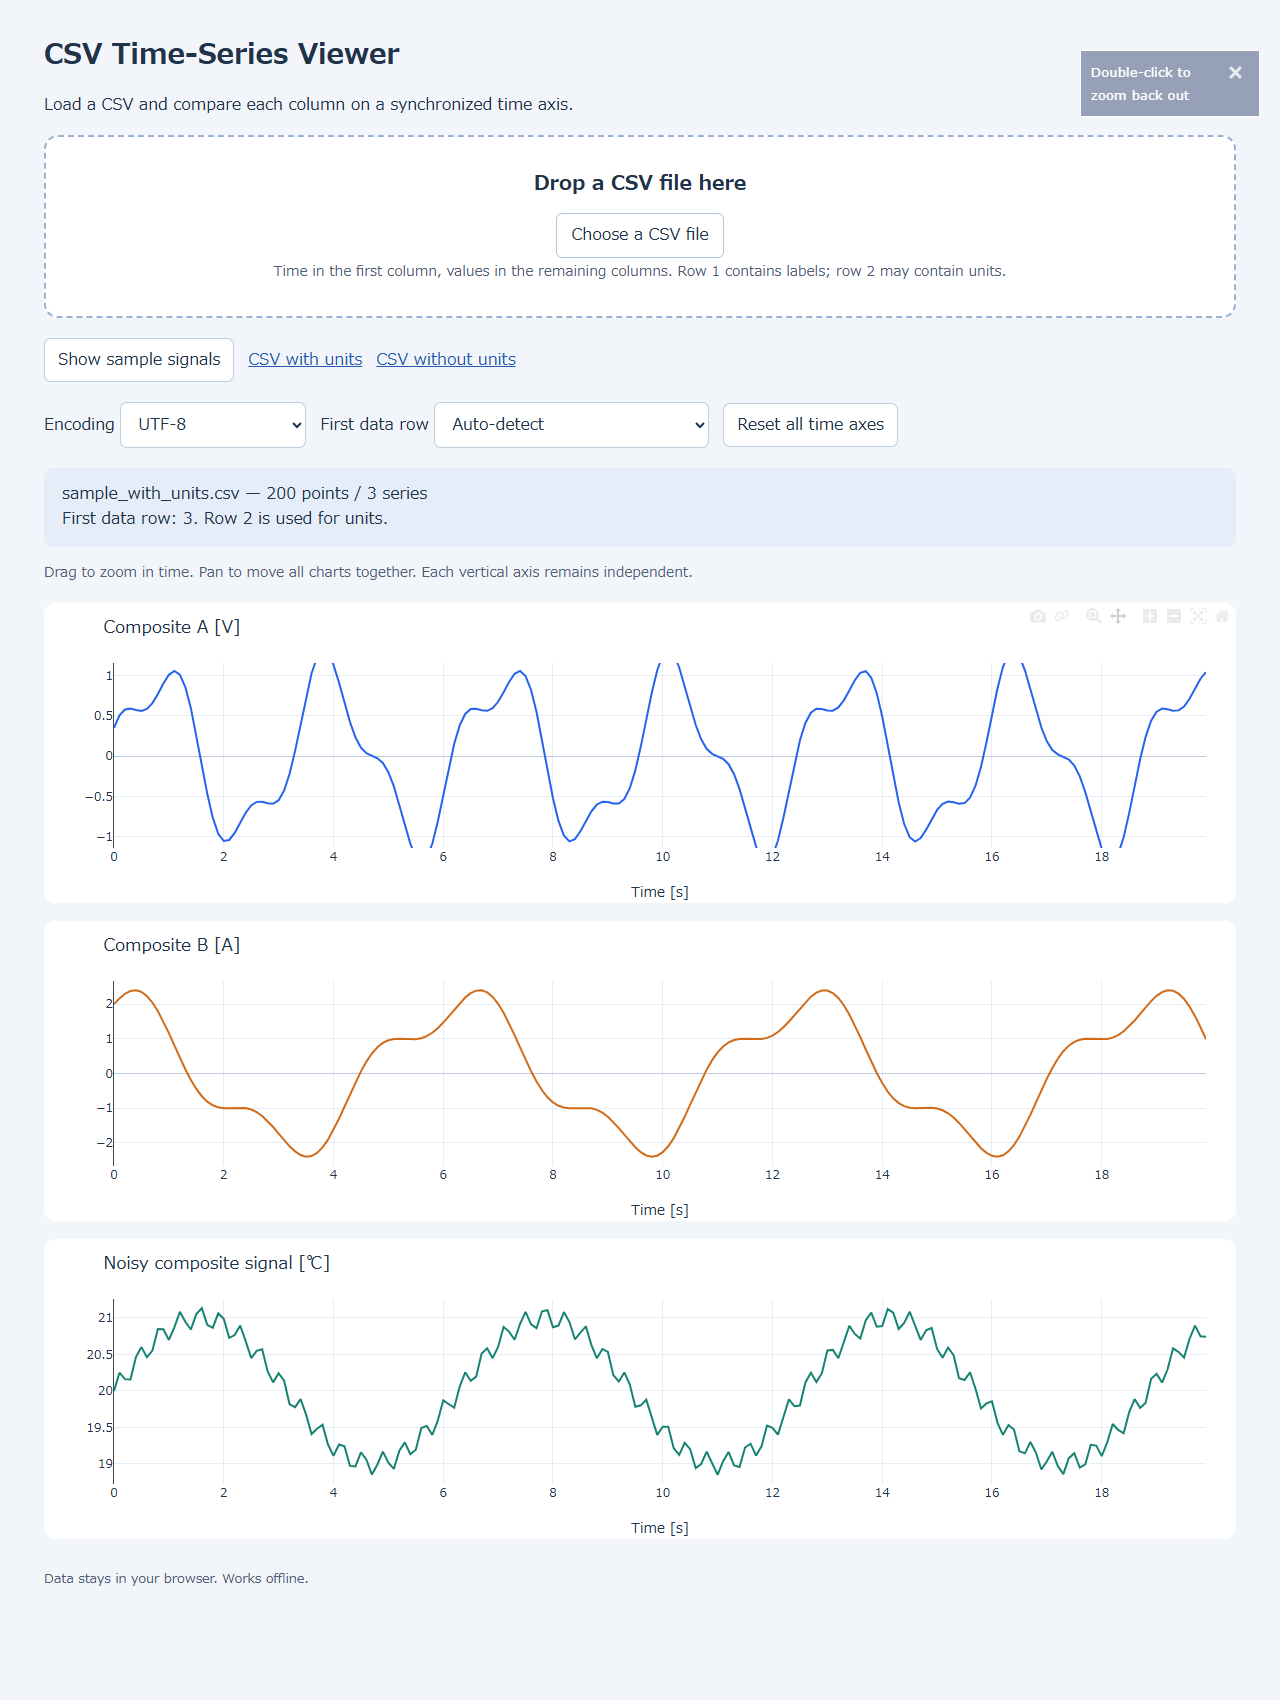
Even when the waveforms differ, matching the time axes makes it easier to follow what the other signals do before and after a change.
Seeing the synchronized charts in action
Here’s a recording of loading the CSV and interacting with the charts.
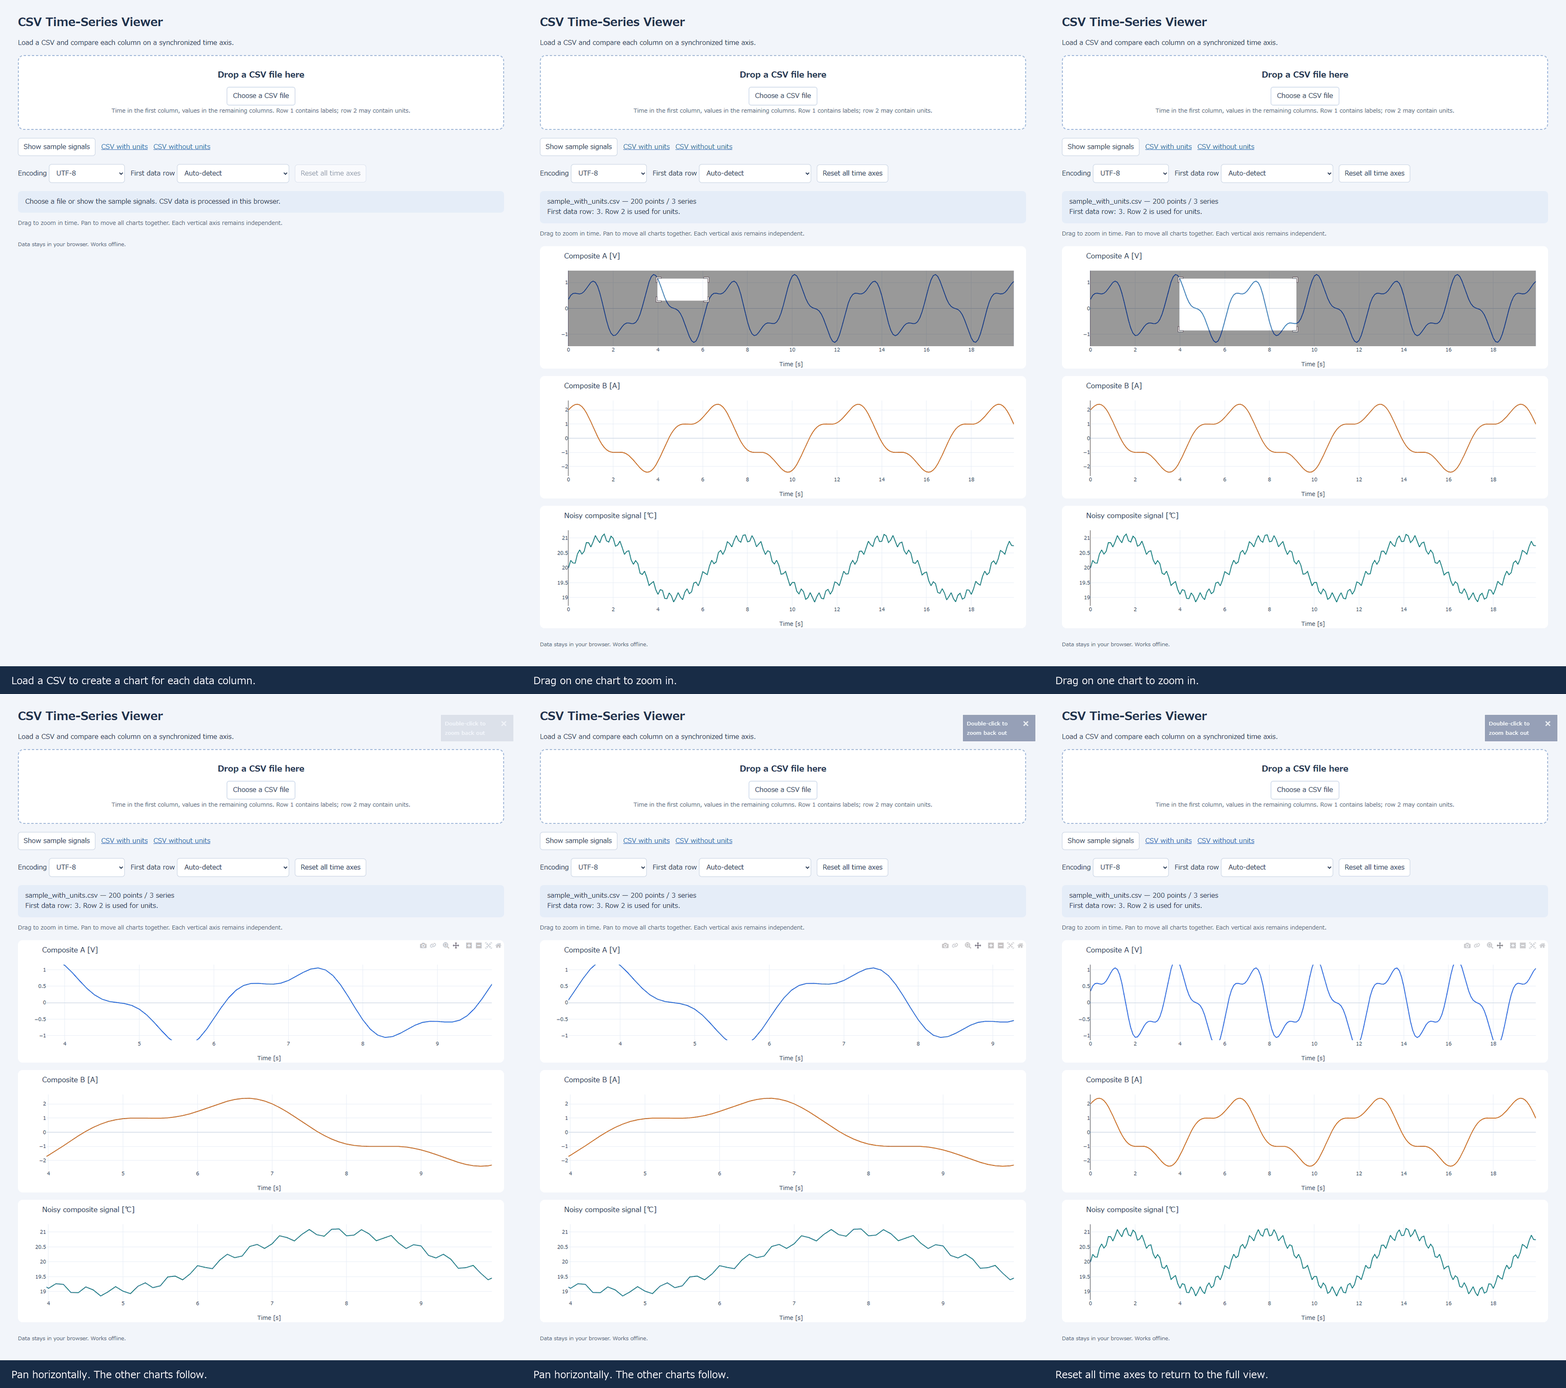
Zooming the top chart changes the time range in the other two charts as well. Horizontal panning and returning to the full view also update them together, so you can keep track of the same moment across all three signals.
Reading timestamps and missing measurements
The time axis accepts numeric values such as elapsed seconds, as well as date and time values like these.
Time,Temperature,Voltage
2026-01-01T12:00:00,25.0,12.1
2026-01-01T12:00:01,25.2,12.0
2026-01-01T12:00:02,25.5,11.9
Keep the time values in ascending order. If time goes backward partway through a file, the tool displays an error.
If measurement values contain blanks or missing-value markers such as NaN, the chart leaves a gap in the line. Plotting missing values as zero could make an unrecorded interval look like a sudden change in the measurement.
You can select UTF-8 or Shift_JIS / CP932 as the encoding. If Japanese column names appear garbled, change the encoding selection and reload the file.
Comparing measurement logs at the same moment
I tested CSV loading, unit-row detection, synchronized zooming and panning, and returning to the full time range with 200-point composite signals.
For logs containing temperature, voltage, and current recorded together, zooming in once lets you compare the changes in each column side by side in time.
If your measurements produce the same CSV format each time, this could help reduce the work of preparing charts.
See you next time!


コメント