Hi, Higashi here.
Suppose you want to push four times as much air through the same duct. Would four times the inlet pressure do it?
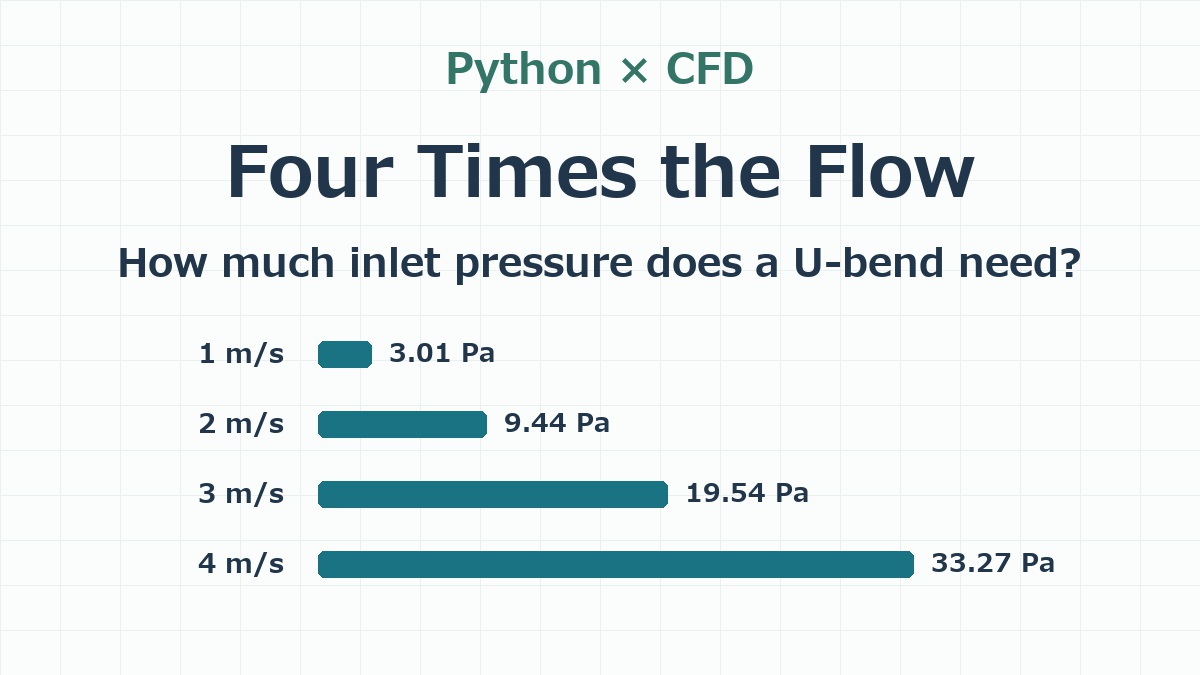
I tried it with the Python CFD solver from my earlier posts. I sent air through a U-shaped duct with a 6 mm square cross section, increasing the inlet speed from 1 to 2, 3 and finally 4 m/s. Getting four times the flow through this particular duct took about 11 times the inlet gauge pressure.
Set the flow at the inlet and the pressure at the outlet
When the question is “How much pressure does it take to deliver this flow?”, a common CFD setup is to prescribe the flow rate at the inlet and the static pressure at the outlet. Imagine a duct that opens into the room. The surrounding air sets the outlet pressure, and the calculation tells you how far above it the inlet pressure needs to be. OpenFOAM’s examples of inlet and outlet boundary conditions.
I specified a uniform speed across the inlet. Its area stays at 6 × 6 = 36 mm², so setting the speed also sets the volume flow rate. At 1 m/s, that gives 2.16 L/min. At 4 m/s, it gives 8.64 L/min. For all four runs, I held the outlet at atmospheric pressure, or 0 Pa gauge.
I kept the 0.5 mm grid with 19,872 fluid cells, the same duct geometry, air at 300 K, no-slip walls and the RNG k–ε turbulence model. Once the flow settled, I took the static pressures from the first layer of cells, whose centers sit 0.25 mm inside the inlet, and averaged them using the inlet face areas as weights. That’s the inlet static pressure reported below.
Four times the flow takes the inlet from 3.01 to 33.27 Pa
| Inlet speed | Volume flow rate | Inlet static pressure (gauge) | Estimated total pressure loss |
|---|---|---|---|
| 1 m/s | 2.16 L/min | 3.01 Pa | 2.67 Pa |
| 2 m/s | 4.32 L/min | 9.44 Pa | 8.91 Pa |
| 3 m/s | 6.48 L/min | 19.54 Pa | 18.60 Pa |
| 4 m/s | 8.64 L/min | 33.27 Pa | 31.74 Pa |
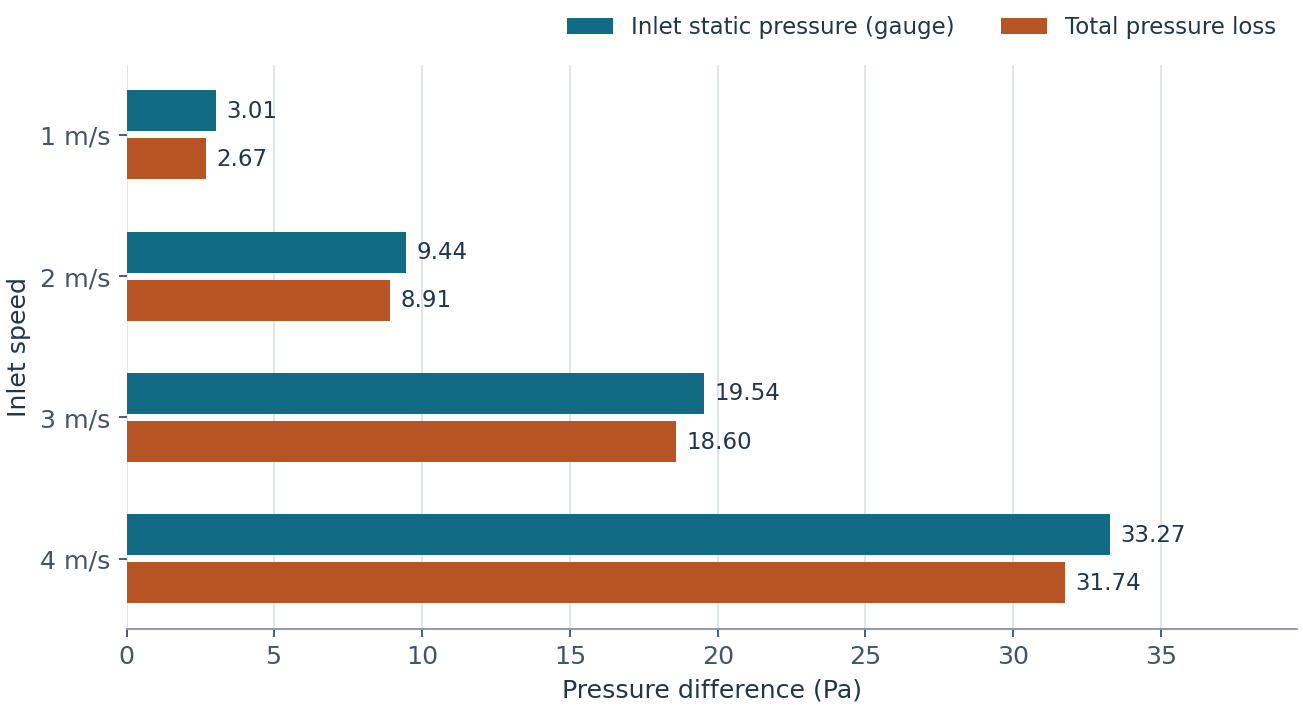
Each step added 1 m/s at the inlet, but the pressure increments got bigger. Going from 1 to 2 m/s took an extra 6.43 Pa. Going from 3 to 4 m/s took another 13.73 Pa, more than twice as much for the same increase in flow.
Should you use static or total pressure to assess a loss?
Imagine comparing this square-cornered U-bend with one that has rounded corners, both carrying the same flow. To find out which duct costs the air more mechanical energy, I’d compare the drop in flow-weighted mean total pressure between equivalent inlet and outlet sections. For a level duct with no fan between those sections, that drop measures the loss through the duct. If the question is how far above atmospheric pressure the inlet must be to deliver a given flow to an open outlet, the static pressure difference gives that answer directly.
Total pressure is static pressure plus dynamic pressure, ½ρv², where ρ is the air density and v is the local speed. The inlet speed is uniform. After two turns, some parts of the outlet carry faster air than others. I calculated total pressure on each outlet face and weighted each value by the flow through that face.
Take the 4 m/s run. Dynamic pressure is 9.42 Pa at the inlet and averages 10.95 Pa at the outlet when weighted by flow. The total pressure loss is (33.27 + 9.42) − (0 + 10.95) ≈ 31.74 Pa. That covers the entire duct, including both corners and the straight sections.
Both openings are 6 mm square, so the mean velocity through each opening is 4 m/s. Yet about 1.53 Pa of the 33.27 Pa static pressure drop corresponds to the increase in flow-weighted dynamic pressure. When the inlet and outlet velocity profiles are similar, the dynamic pressure terms nearly cancel and the static pressure drop can approximate the total loss. Here the inlet profile is uniform and the outlet still carries the imprint of the bend. Equal areas alone don’t make those terms cancel. ASHRAE Handbook chapter on duct design and pressure losses.
How fast is the air after the bend?
The maps below show a horizontal slice halfway up the duct. Air enters at the lower left, turns back at the far right and leaves at the upper left. All four maps use the same scale in m/s, so a given color means the same speed in every run.
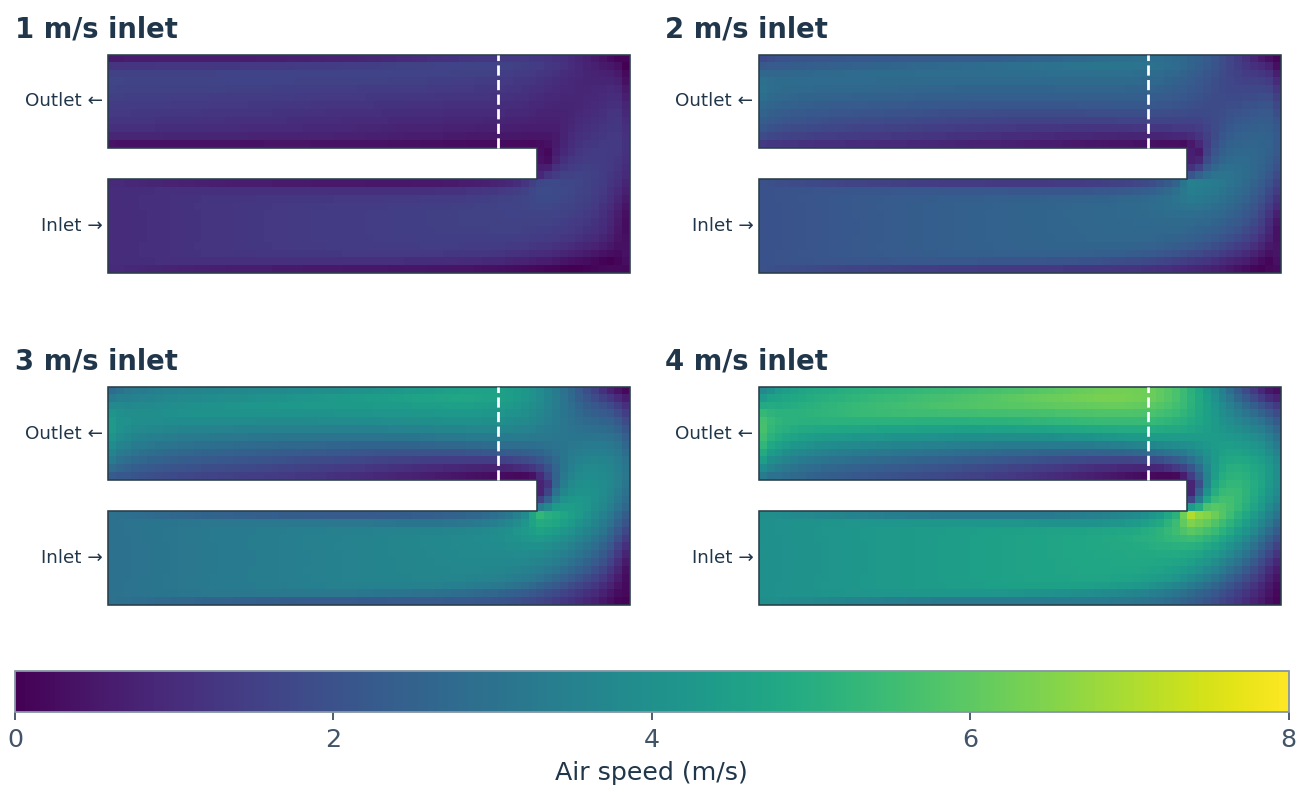
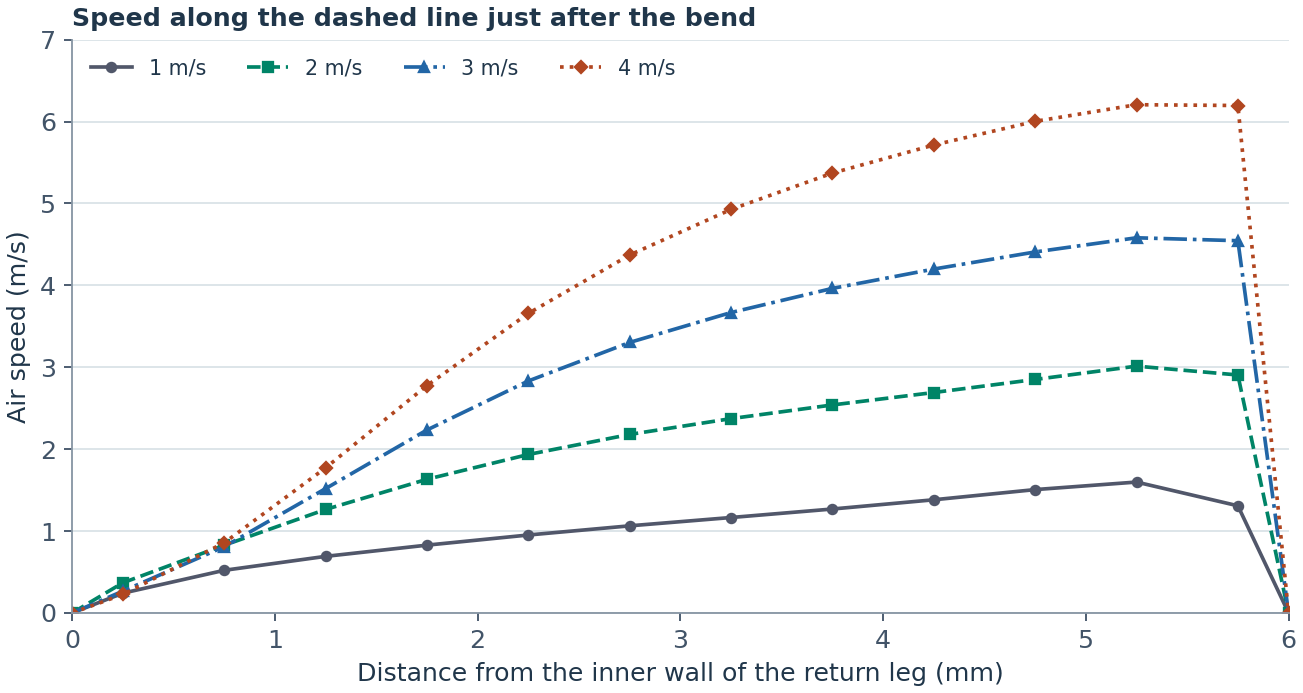
Start at the inner wall on the left and follow the curves to the right. The four lines start close together and fan out toward the outer wall. The peaks along this line are 1.60, 3.01, 4.58 and 6.21 m/s, in order of increasing inlet speed. Raising the inlet from 1 to 4 m/s made the air near the outer-wall peak about 4.6 m/s faster.
How does the pattern change relative to the inlet speed?
Now look at the same slice and the same line with local speed divided by inlet speed. A value of 1.5 means 1.5 m/s for the 1 m/s inlet and 6 m/s for the 4 m/s inlet. This makes it easier to see how strongly the flow favors one side of the duct as the flow rate rises.
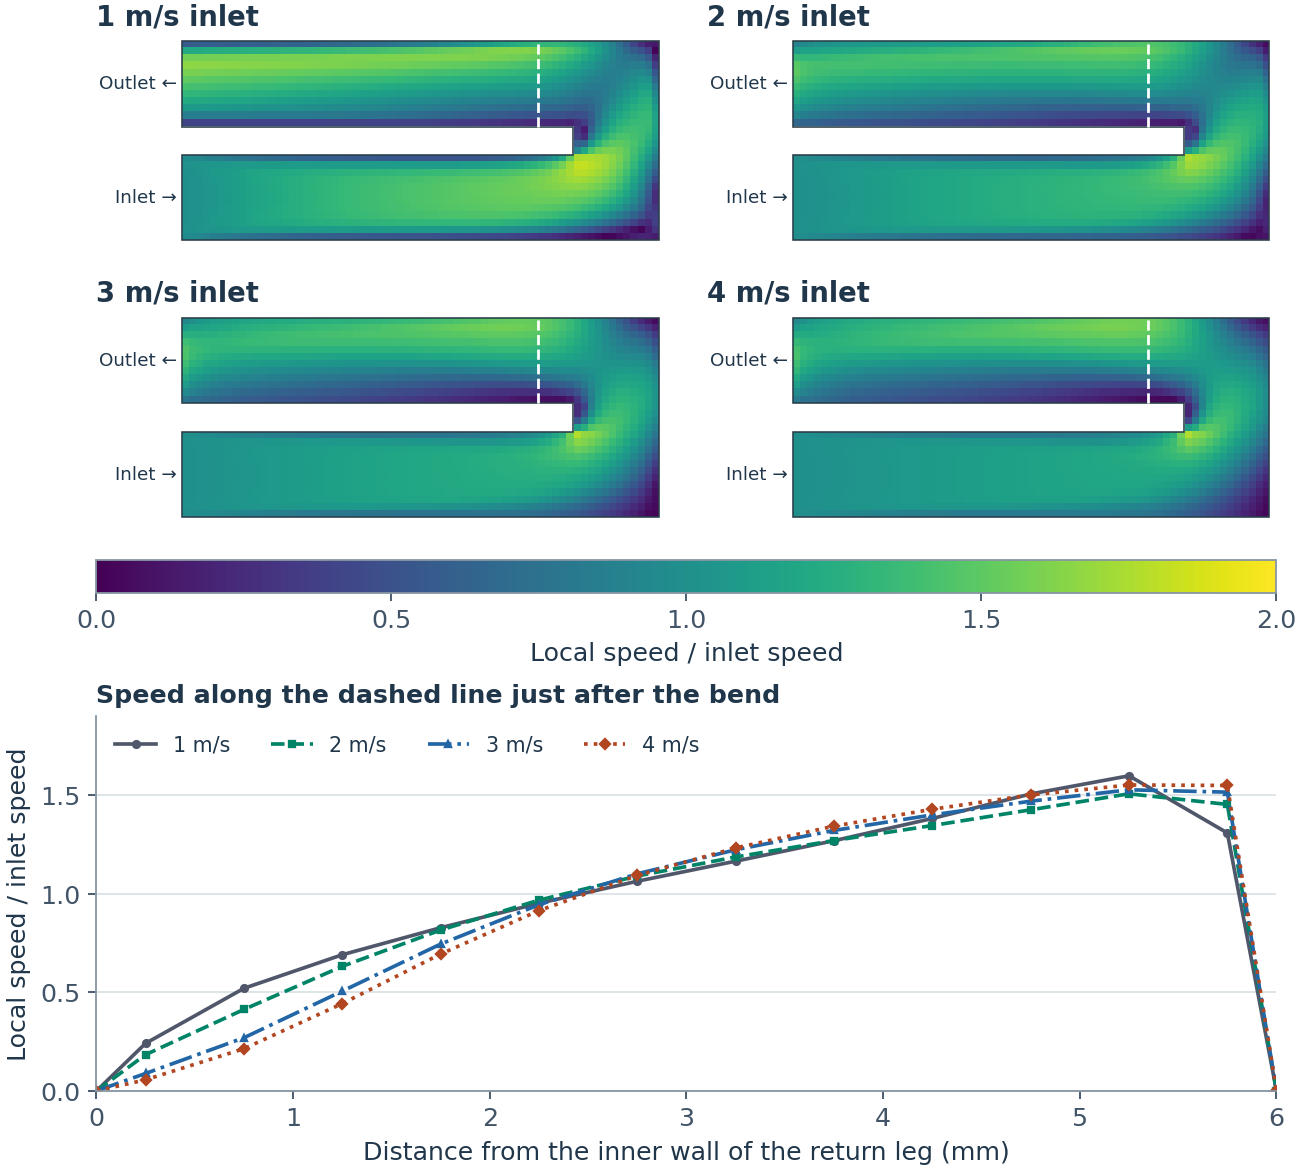
In all four runs, the fast air hugs the outside of the bend just after the turn. Along the dashed line, the peak falls in the cell centered 0.75 mm from the outer wall. Its speed is about 1.5 to 1.6 times the inlet speed.
Now look the same distance from the inner wall. As the inlet goes from 1 to 4 m/s, the local speed falls from 0.52 to 0.21 times the inlet speed. In m/s, it actually rises from about 0.52 to 0.86. Four times as much air passes through the duct, yet the speed at this spot doesn’t even double.
The roughly elevenfold increase in inlet gauge pressure is the result for this 6 mm duct, over a Reynolds number range of about 380 to 1,530. A different duct width or bend shape can change how much pressure the same flow needs. For the solver itself and a closer look at how grid spacing changes the speed maps, see the two earlier posts.


コメント