Hi, Higashi here.
Early in my career, I was using CFD to work out the pressure loss in a duct with a complicated shape. One result puzzled me. As I moved my measurement plane downstream, the total pressure appeared to go up.
I traced it back to the way I’d averaged the pressure at each cross-section. I’d given each part of the section a weight proportional to its area. What I learned from that experience was that, to find the loss experienced by the air passing through a duct, I needed to weight the local total pressure by the mass flow rate through each part.
To see why, let’s try a shape that makes the difference easy to spot. I used the same Python CFD solver as in my last post.
Make just one part of the duct five times wider
First, here’s the setup. The inlet and outlet are both 6 mm square. The duct is horizontal and 20 mm long. For just 6 mm of that length, it widens to 30 mm, with a pocket on either side. Its height stays at 6 mm throughout.
I sent air at 300 K into the duct at 4 m/s and fixed the outlet static pressure at atmospheric pressure. The grid spacing was 0.5 mm. In the top view below, air flows from left to right.
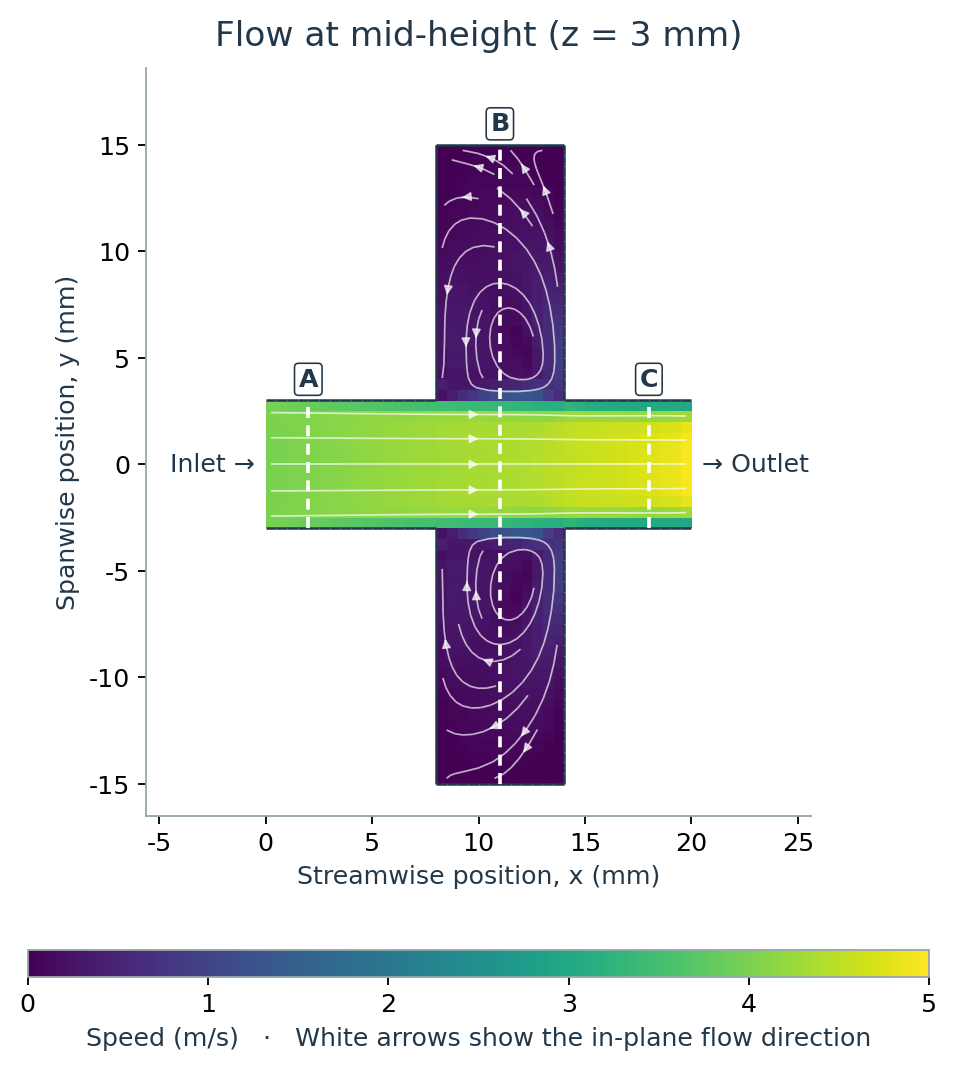
At B, the fast-moving air continues almost straight toward the outlet. Follow the streamlines in the purple pockets and you can see air slowly circulating there. How much weight should those pockets get when we average the pressure across B?
Why does the area average rise as the air approaches the outlet?
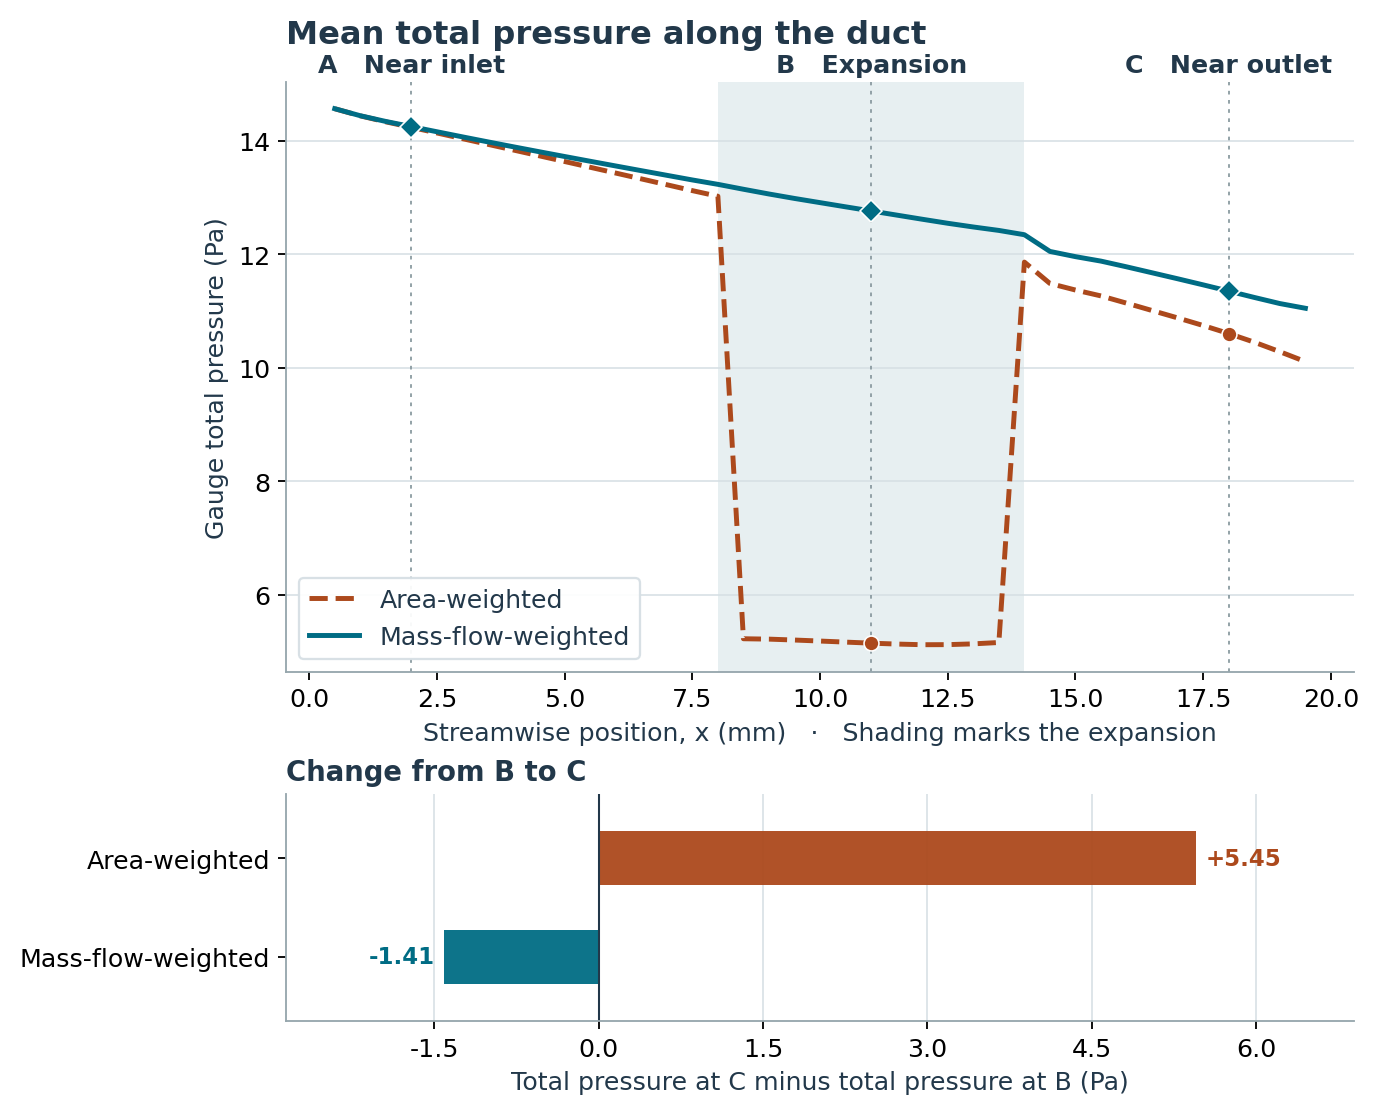
Total pressure is static pressure plus dynamic pressure (½ × air density × speed squared). I calculated total pressure on each small face in a cross-section, then averaged those same values two ways. All pressures below are relative to atmospheric pressure.
| Section | Area | Area-weighted total pressure | Mass-flow-weighted total pressure |
|---|---|---|---|
| A · Near inlet | 36 mm² | 14.23 Pa | 14.25 Pa |
| B · Expansion | 180 mm² | 5.15 Pa | 12.76 Pa |
| C · Near outlet | 36 mm² | 10.60 Pa | 11.35 Pa |
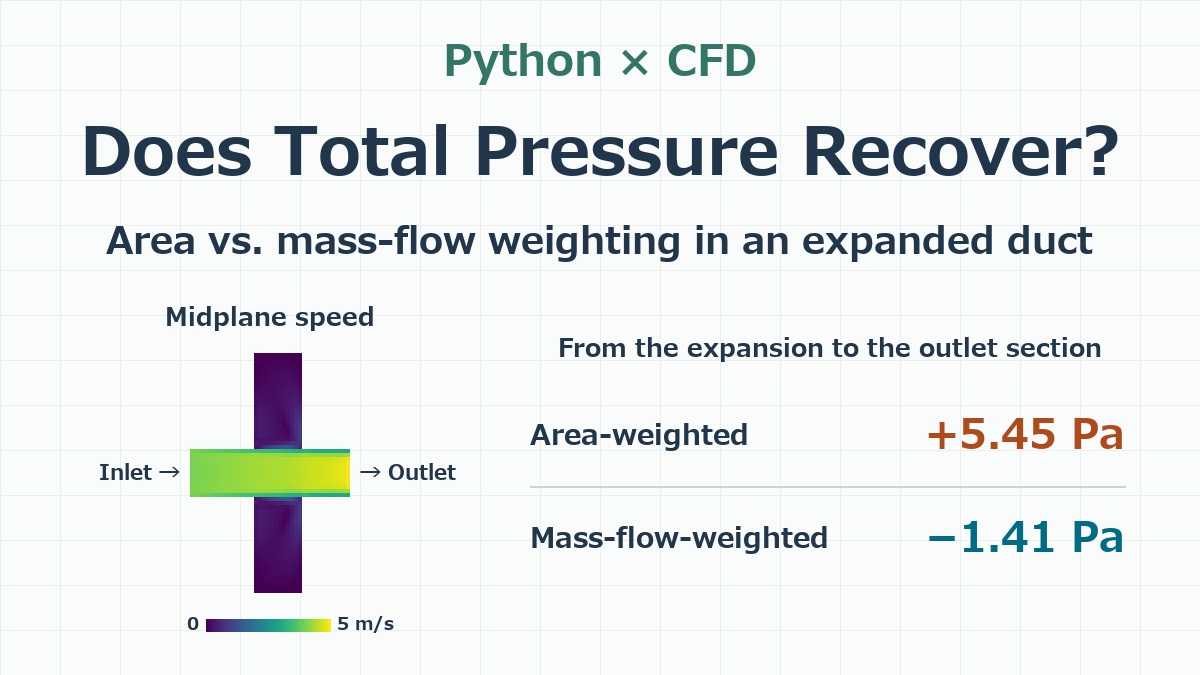
At A, both averages are about 14.2 Pa. Now follow the area-weighted column. It drops to 5.15 Pa at B, then climbs back to 10.60 Pa at C. That looks like a 5.45 Pa recovery in total pressure. Where would the extra energy have come from? There’s no fan between B and C.
The side pockets take up 80% of the area. How much air actually goes through them?
Here’s section B viewed from downstream, looking back toward the inlet. The dashed lines enclose the central strip, which is as wide as the original duct. The upper panel shows velocity perpendicular to the section. The lower panel shows total pressure at the same locations.
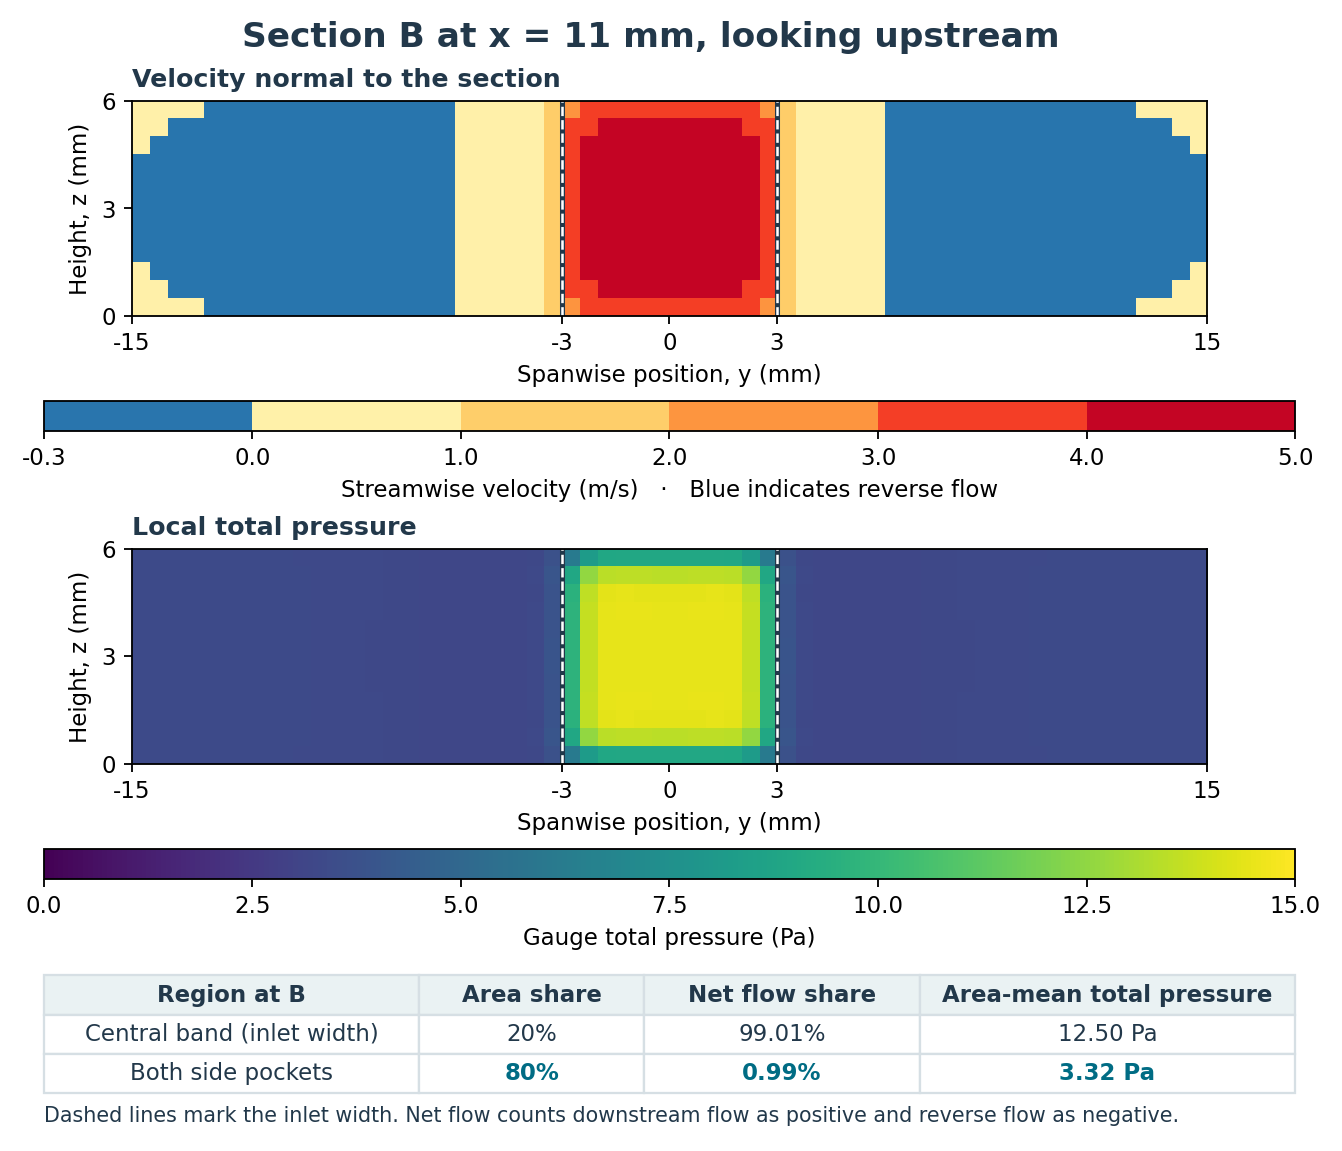
The central strip takes up only 20% of the section, yet it carries 99.01% of the net mass flow. The two pockets take up the other 80% but together carry only 0.99%. “Net” matters here. We count air moving downstream as positive and subtract the air that the recirculation carries back upstream.
The area-averaged total pressure is 12.498 Pa in the central strip and just 3.317 Pa in the pockets. Put those numbers together by area and you get 12.498 × 0.2 + 3.317 × 0.8 ≈ 5.15 Pa. The pockets get 80% of the weight even though they carry about 1% of the net flow.
By section C the duct is back to its original width. Those broad, low-total-pressure regions have disappeared from the cross-section, so they no longer pull the area average down. That’s how the line on the graph can rise without the air picking up energy along the way.
Weight the pressure by the air that passes through
The question I’d wanted to answer all those years ago was, “How much energy does the air lose as it passes through this duct?” Imagine two faces of equal area. If ten times as much air passes through one of them each second, I want that face to carry ten times the weight in my average.
For each face, multiply its total pressure by its signed mass flow rate. Add those products across the section, then divide by the net mass flow rate through the whole section. In a horizontal duct with constant-density air, total pressure divided by density gives the mechanical energy per unit mass, relative to the pressure reference. Weighting by the mass passing through each face lets us track how much of that energy the flow carries downstream.
With that weighting, the total pressures are 14.25 Pa at A, 12.76 Pa at B and 11.35 Pa at C. Across the same stretch from B to C, the air loses 1.41 Pa of total pressure. I also halved the grid spacing to 0.25 mm. The area average rose by 5.81 Pa and the mass-flow-weighted average fell by 1.24 Pa, so the same pattern showed up on the finer grid.
If I’d looked only near the inlet, I doubt I’d have given the averaging method much thought. It took a section like B, where nearly all the air goes through one small part, to make the difference clear. If you run into a puzzling pressure-loss result, try plotting the velocity on the section you’re averaging. How much air is actually getting through that big patch on the plot?
In my previous post, I increased the flow through a U-bend and compared the inlet static pressure needed to drive it with the total pressure lost along the duct. If you’re choosing between static and total pressure for a calculation, you can see that example here.
How Much Inlet Pressure Does It Take to Quadruple the Flow Through a U-Bend?


コメント