Hi, this is Higashi.
Battery capacity is one of the first things I look at when choosing an EV. But if two cars have the same battery capacity and charge left, how much does their energy consumption change where they can go?
This time I started at Tokyo Station and ran the numbers for three rates: 120, 150, and 200 Wh/km. I reused the Python mapping program from my previous post and drew the reachable roads on maps with the same scale and extent.
How far can you drive with 6 kWh left?
The battery has a capacity of 60 kWh and a state of charge (SOC) of 10%. That leaves 6,000 Wh to work with in all three cases. To get the one-way distance limit, I divided that energy by the amount used to drive 1 km.
| Energy consumption | Distance per kWh | Distance with 6 kWh left |
|---|---|---|
| 120 Wh/km | About 8.33 km | 50 km |
| 150 Wh/km | About 6.67 km | 40 km |
| 200 Wh/km | 5.00 km | 30 km |
At 150 Wh/km, for example, 6,000 ÷ 150 gives you 40 km. Wh/km measures how much energy it takes to drive 1 km, so a smaller number means you can go farther on the same charge. If a car’s specs are listed in km/kWh, a larger number means you can go farther.
Comparing three consumption rates in Python
For this comparison, I reused the program from my previous post on mapping an EV’s driving range with Python. That post has the full code for loading the road data, finding the reachable road segments, and overlaying them on the map with Pillow. Here, I use the same process with three different consumption rates.
I used major roads from OpenStreetMap and calculated the shortest driving distances from a point on the road network near Tokyo Station, accounting for one-way streets. Since the starting point and road data are the same in all three cases, I only needed to calculate distances once, up to 50 km. Then I used each distance limit to pick out the reachable road segments.
Here’s the part I changed. reachable_segments finds how much of each road segment you can drive before reaching the limit.
energy_wh = 60 * 1000 * 0.10
consumptions = (120, 150, 200)
budgets = [energy_wh / rate for rate in consumptions]

# Calculate road distances once, using the longest range.
_, _, distances = shortest_distances(
    graph, coords, origin, max(budgets) * 1000
)

for rate, budget_km in zip(consumptions, budgets):
    left, right, full, partial = reachable_segments(
        u, v, lengths, direction, distances, budget_km * 1000
    )
    # Draw fully and partially reachable road segments.
Comparing the driving ranges from Tokyo Station
Here’s what the results look like. The blue dot marks Tokyo Station, and the purple lines in the top left, top right, and bottom left show the major roads you can reach in each case. The maps all cover the same area at the same scale. Look near the edges to see how much farther the lines extend.
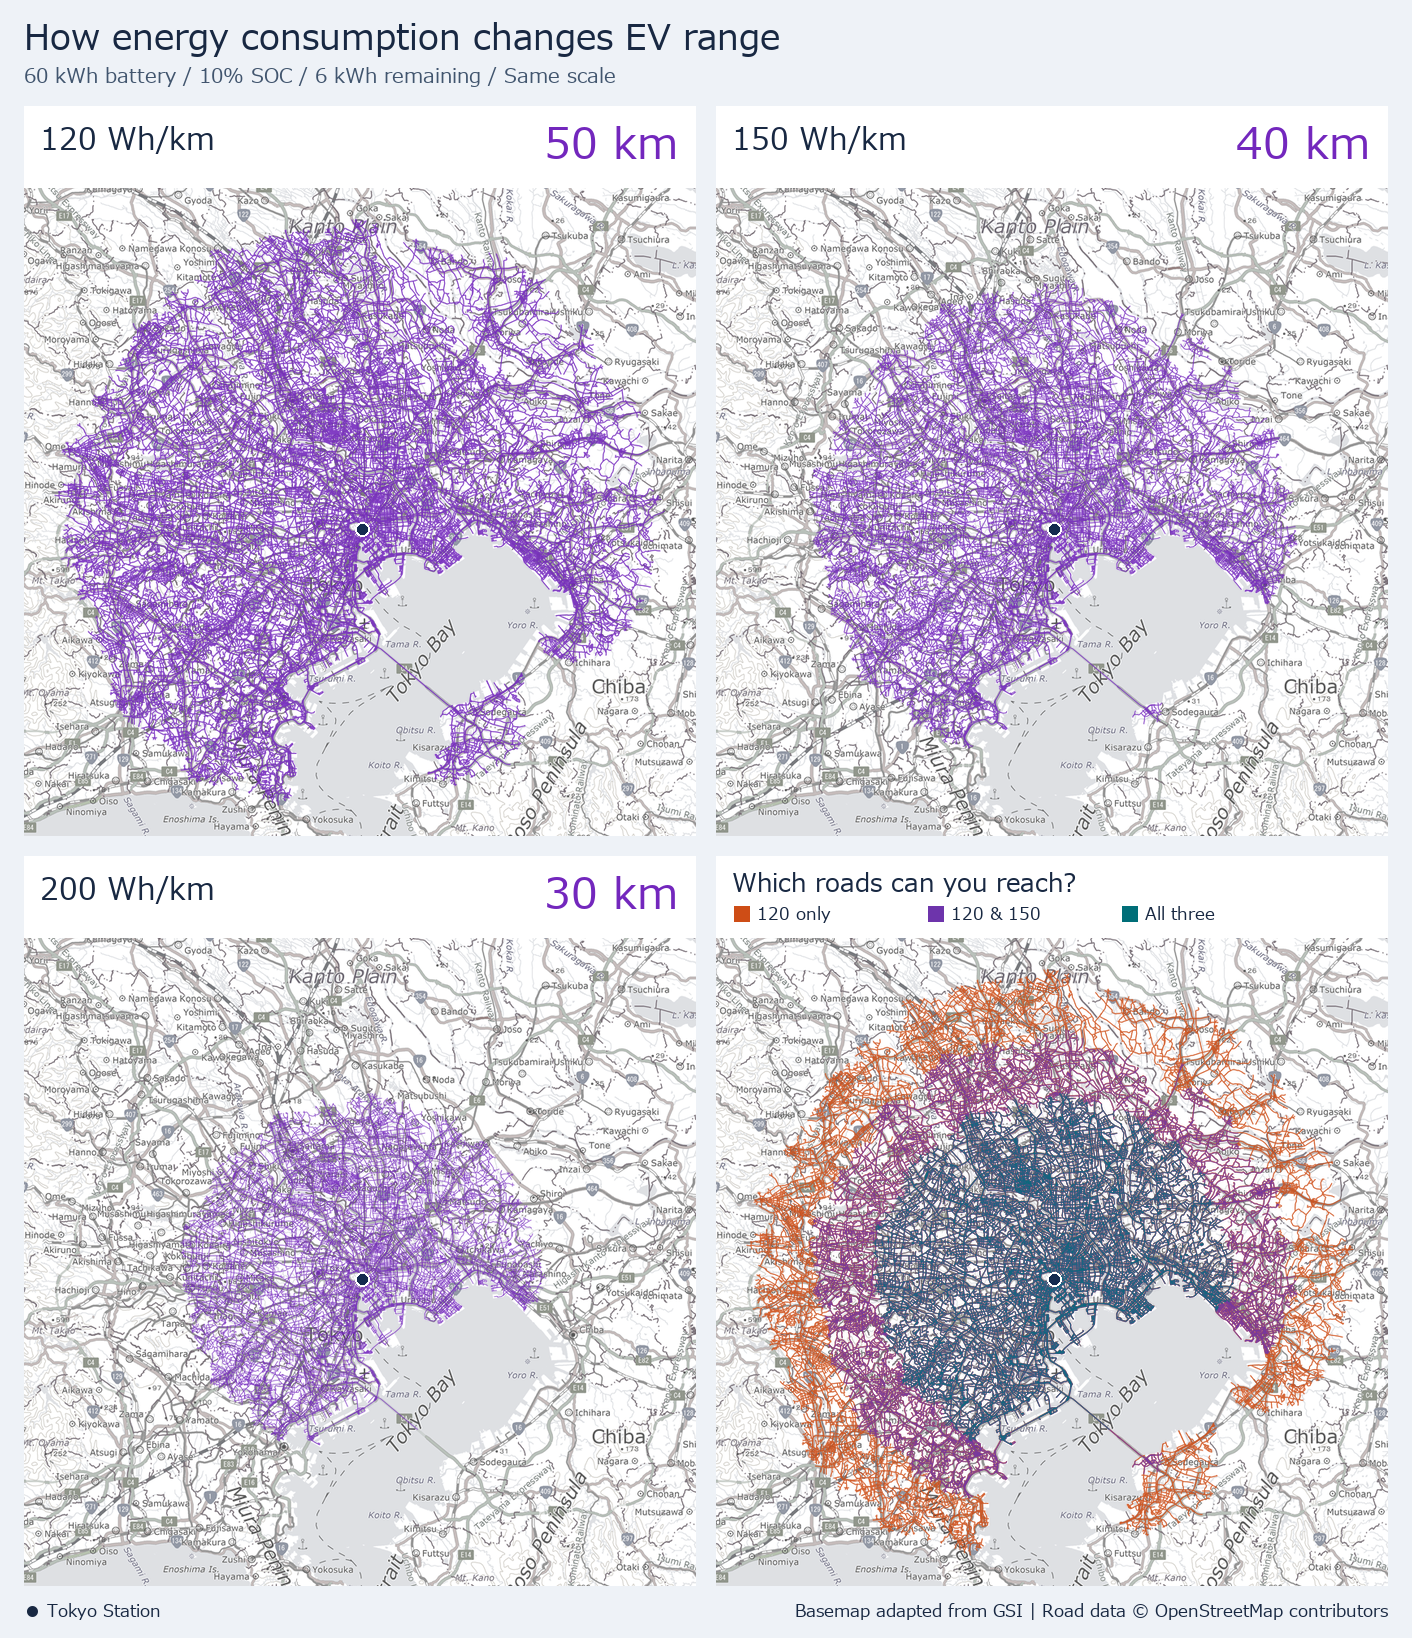
On the bottom-right map, teal marks roads you can reach in all three cases, purple marks roads you can reach at 120 and 150 Wh/km, and orange marks roads you can reach only at 120 Wh/km. Take the road across Tokyo Bay, for example. With 30 km of range, you only get partway across. With 40 km, the line reaches the Kisarazu side of the bay. The orange and purple lines spread unevenly because where you can go on the same charge depends on how the roads connect.
Checking energy consumption when choosing a car
Under these assumptions, if your destination is 35 km away by road, you could reach it at 150 Wh/km. At 200 Wh/km, you’d run out of range before getting there. Even with the same 60 kWh battery, energy consumption changes which destinations you can reach when the charge is low.
In practice, energy consumption varies with speed, temperature, and road gradient. For these estimates I held consumption constant and left out factors such as a reserve for reaching a charger and turn restrictions at individual intersections. When comparing cars, I find it helps to look at energy consumption alongside battery size under comparable driving conditions.
If you’re curious about how I made the maps, see my earlier post on mapping an EV’s driving range with Python. It includes sample code for calculating driving distances with OpenStreetMap road data and drawing the results on a map with Pillow.
See you next time!
コメント