
Hi, Higashi here.
An electric car’s navigation system can tell you how many kilometers you have left. But it’s surprisingly hard to tell where you can actually get to from that number alone.
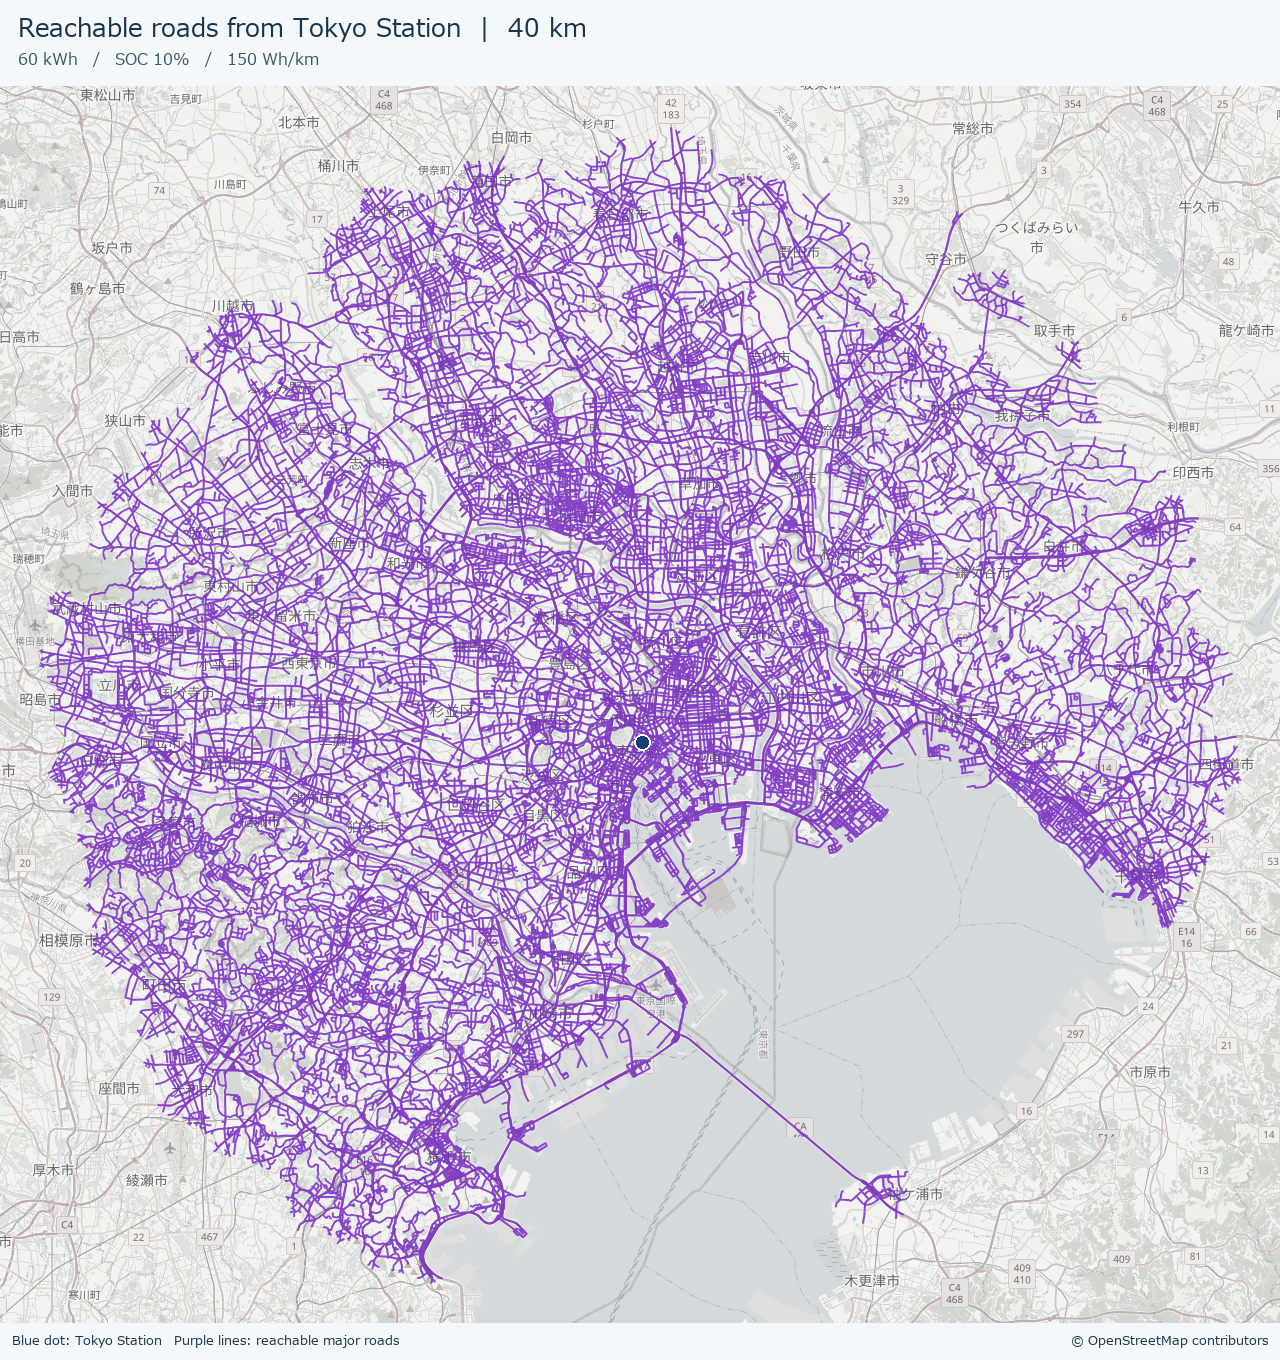
Suppose you’re at Tokyo Station with 10% battery left. How far could you go if you kept driving at your current rate of energy consumption? I used Python and OpenStreetMap road data to put the answer on a map. Then I ran the same calculation from Osaka Station to see how the results compare.
Let’s get started!
Calculating how far we can still drive
Here are the assumptions for this example.
- Starting points: Tokyo Station and Osaka Station, calculated separately
- Battery capacity: 60 kWh
- Remaining state of charge (SOC): 10%
- Average energy consumption: 150 Wh/km
The idea is to use the average energy consumption so far. For this example, I use a fixed 150 Wh/km on every road. Ten percent of 60 kWh is 6 kWh. Convert that to watt-hours and divide by the energy consumption per kilometer, and you get the following:
Remaining energy = 60 × 1,000 × 0.10 = 6,000 Wh
Driving range = 6,000 ÷ 150 = 40 km
I chose 150 Wh/km for this test. The 40 km is the calculated one-way range under these assumptions, using all the remaining battery energy.
Measuring distance along the roads
If you draw a circle with a 40 km radius around Tokyo Station, some of it ends up over the sea. So I treated the roads on the map as a network of connected segments.
In OpenStreetMap, a road is recorded as a way: a sequence of connected points. I calculate the distance between consecutive points and, for a one-way road, connect them only in the permitted direction. Even if two roads appear to cross on the map, the program can only switch from one to the other if they share a point in OpenStreetMap.
From a point on the road near the starting station, I use SciPy’s implementation of Dijkstra’s algorithm to find the shortest distance to each point. Say you’ve driven 39 km to reach an intersection. Even if the next stretch is 3 km long, you can still drive the first kilometer of it. The example draws that stretch up to where you run out of range.
Libraries and road data
I tested this with Python 3.11. Here are the four libraries used in the example.
- osmium (Pyosmium): reads the OpenStreetMap PBF file.
- NumPy: works with latitude, longitude, and road distances as arrays.
- SciPy: calculates shortest distances through the road network.
- Pillow: overlays the reachable roads on the base map and saves the result as a PNG.
I used the OpenStreetMap data for Japan distributed by Geofabrik. [Download the Japan road data from Geofabrik]
Sample code
Here’s the Python code I used. It extracts major roads, including expressways and arterial roads, as well as their connecting ramps, from the nationwide dataset.
Show the Python code
"""Generate PNG maps of the major roads reachable from Tokyo and Osaka Stations."""

import argparse
from array import array
from pathlib import Path
from io import BytesIO
from math import asinh, ceil, floor, log2, radians, tan
from urllib.request import Request, urlopen


import numpy as np
import osmium
from PIL import Image, ImageDraw, ImageEnhance, ImageFont
from scipy.sparse import csr_matrix
from scipy.sparse.csgraph import dijkstra


STATIONS = {
    "tokyo": ("Tokyo Station", (35.68126, 139.76671)),
    "osaka": ("Osaka Station", (34.70221, 135.49557)),
}
CAPACITY_KWH = 60
SOC = 0.10
CONSUMPTION_WH_PER_KM = 150
EARTH_RADIUS_M = 6_371_008.8
OVERLAY_PIXELS = 6144
OVERLAY_STROKE_PX = 10
OVERLAY_OPACITY = 0.85
ROAD_COLOR = "#7327bd"
ROADS = {"motorway", "trunk", "primary", "secondary", "tertiary"}
ROADS |= {road + "_link" for road in ROADS}
NO_ACCESS = {"no", "private", "destination", "customers", "delivery"}


def distance_m(a, b):
    """Return the great-circle distance in meters between latitude/longitude pairs."""
    lat1, lon1 = np.deg2rad(np.asarray(a).T)
    lat2, lon2 = np.deg2rad(np.asarray(b).T)
    h = np.sin((lat2 - lat1) / 2) ** 2
    h += np.cos(lat1) * np.cos(lat2) * np.sin((lon2 - lon1) / 2) ** 2
    return 2 * EARTH_RADIUS_M * np.arcsin(np.sqrt(np.clip(h, 0, 1)))


def driving_direction(tags):
    """Return 0 for two-way roads, 1 for OSM node order, and -1 for reverse order."""
    access = (tags.get("motorcar") or tags.get("motor_vehicle")
              or tags.get("vehicle") or tags.get("access"))
    if access in NO_ACCESS or tags.get("area") == "yes":
        return None

    one_way = (tags.get("oneway:motorcar") or tags.get("oneway:motor_vehicle")
               or tags.get("oneway"))
    if one_way == "-1":
        return -1
    if one_way in {"reversible", "alternating"}:
        return None
    if one_way in {"yes", "1", "true"}:
        return 1
    if one_way is None and (
        tags.get("highway") == "motorway"
        or tags.get("junction") in {"roundabout", "circular"}
    ):
        return 1
    return 0


def read_roads(pbf):
    """Read road directions and node sequences, then load only the coordinates they use."""
    node_index = {}
    vertices = array("I")
    ends = array("I", [0])
    directions = array("b")
    ways = osmium.FileProcessor(pbf, osmium.osm.WAY).with_filter(
        osmium.filter.TagFilter(*[("highway", road) for road in sorted(ROADS)])
    )
    for way in ways:
        direction = driving_direction(way.tags)
        if direction is None or len(way.nodes) < 2:
            continue
        for node in way.nodes:
            vertices.append(node_index.setdefault(node.ref, len(node_index)))
        ends.append(len(vertices))
        directions.append(direction)

    if not node_index:
        raise ValueError("No matching roads found. Provide an OSM PBF file for Japan.")

    coords = np.full((len(node_index), 2), np.nan)
    nodes = osmium.FileProcessor(pbf, osmium.osm.NODE).with_filter(
        osmium.filter.IdFilter(node_index.keys())
    )
    for node in nodes:
        if node.location.valid():
            coords[node_index[node.id]] = node.location.lat, node.location.lon

    return coords, np.asarray(vertices), np.asarray(ends), np.asarray(directions)


def get_segments(vertices, ends, directions):
    # Do not create an edge between the end of one way and the start of the next.
    keep = np.ones(vertices.size - 1, dtype=bool)
    keep[ends[1:-1] - 1] = False
    return vertices[:-1][keep], vertices[1:][keep], np.repeat(
        directions, np.diff(ends) - 1
    )


def build_graph(coords, u, v, lengths, direction):
    node_count = len(coords)
    valid = np.isfinite(lengths) & (u != v)
    forward = valid & (direction >= 0)
    backward = valid & (direction <= 0)
    rows = np.concatenate((u[forward], v[backward])).astype(np.int64)
    cols = np.concatenate((v[forward], u[backward]))
    weights = np.concatenate((lengths[forward], lengths[backward]))

    # Deduplicate node pairs so the sparse matrix does not sum repeated edges.
    _, indexes = np.unique(rows * node_count + cols, return_index=True)
    return csr_matrix(
        (np.maximum(weights[indexes], 0.001), (rows[indexes], cols[indexes])),
        shape=(node_count, node_count),
    )


def shortest_distances(graph, coords, origin, limit_m):
    station_offsets = distance_m(coords, origin)
    station_offsets[np.diff(graph.indptr) == 0] = np.inf
    if not np.any(np.isfinite(station_offsets)):
        raise ValueError("No coordinates found for drivable roads.")
    start = int(np.nanargmin(station_offsets))
    if station_offsets[start] > 2_000:
        raise ValueError("The dataset does not contain roads close to the starting station.")
    distances = dijkstra(graph, directed=True, indices=start, limit=limit_m)
    return start, float(station_offsets[start]), distances


def reachable_segments(u, v, lengths, directions, distances, limit_m):
    """Return the reachable fraction from either end and masks for fully and partly reachable edges."""
    with np.errstate(divide="ignore", invalid="ignore"):
        left = np.where(directions >= 0, (limit_m - distances[u]) / lengths, 0)
        right = np.where(directions <= 0, (limit_m - distances[v]) / lengths, 0)
    left = np.clip(left, 0, 1)
    right = np.clip(right, 0, 1)
    covered = np.isfinite(lengths) & (lengths > 0)
    full = covered & (left + right >= 1)
    partial = covered & ~full & ((left > 0) | (right > 0))

    return left, right, full, partial


def draw_overlay(coords, u, v, ends, left, right, full, partial):
    """Draw reachable road segments on a transparent image in Web Mercator."""
    reach = full | partial
    endpoints = np.concatenate((coords[u[reach]], coords[v[reach]]))
    south, west = endpoints.min(axis=0) - 0.002
    north, east = endpoints.max(axis=0) + 0.002
    del endpoints

    def mercator_y(lat):
        return np.arcsinh(np.tan(np.deg2rad(lat)))

    ymin, ymax = mercator_y([south, north])
    x_span = np.deg2rad(east - west)
    y_span = ymax - ymin
    scale = (OVERLAY_PIXELS - 1) / max(x_span, y_span)
    width = int(np.ceil(x_span * scale)) + 1
    height = int(np.ceil(y_span * scale)) + 1
    pixels = np.zeros(coords.shape, dtype=np.int32)
    valid = np.isfinite(coords[:, 0])
    pixels[valid, 0] = np.rint((coords[valid, 1] - west) / (east - west) * (width - 1))
    pixels[valid, 1] = np.rint((ymax - mercator_y(coords[valid, 0])) / y_span * (height - 1))

    image = Image.new("RGBA", (width, height))
    draw = ImageDraw.Draw(image)
    color = ROAD_COLOR
    # Join consecutive segments of the same way. Overlapping strokes keep the same color.
    offset = 0
    for count in np.diff(ends) - 1:
        stop = offset + int(count)
        run = []
        previous = offset - 1
        for i in np.flatnonzero(reach[offset:stop]) + offset:
            a, b = tuple(pixels[u[i]]), tuple(pixels[v[i]])
            if run and (i != previous + 1 or not full[i]):
                draw.line(run, fill=color, width=OVERLAY_STROKE_PX)
                run = []
            if full[i]:
                if not run:
                    run.append(a)
                run.append(b)
            else:
                if left[i] > 0:
                    draw.line([a, interpolate(a, b, left[i])], fill=color, width=OVERLAY_STROKE_PX)
                if right[i] > 0:
                    draw.line([interpolate(a, b, 1 - right[i]), b], fill=color, width=OVERLAY_STROKE_PX)
            previous = i
        if run:
            draw.line(run, fill=color, width=OVERLAY_STROKE_PX)
        offset = stop

    return image, [[south, west], [north, east]]


def interpolate(a, b, fraction):
    return tuple(round(x + fraction * (y - x)) for x, y in zip(a, b))


def world_pixel(lat, lon, zoom):
    """Convert latitude and longitude to OpenStreetMap tile pixel coordinates."""
    size = 256 * 2 ** zoom
    return (lon + 180) / 360 * size, (1 - asinh(tan(radians(lat))) / np.pi) / 2 * size


def read_basemap(bounds):
    """Stitch together only the base-map tiles needed for the output image."""
    (south, west), (north, east) = bounds
    a = world_pixel(north, west, 0)
    b = world_pixel(south, east, 0)
    span = max(b[0] - a[0], b[1] - a[1])
    zoom = min(16, max(0, floor(log2(1400 / span))))
    x0, y0 = world_pixel(north, west, zoom)
    x1, y1 = world_pixel(south, east, zoom)
    left, top, right, bottom = floor(x0) - 36, floor(y0) - 36, ceil(x1) + 36, ceil(y1) + 36
    background = Image.new("RGBA", (right - left, bottom - top))
    for ty in range(top // 256, (bottom - 1) // 256 + 1):
        for tx in range(left // 256, (right - 1) // 256 + 1):
            request = Request(
                f"https://tile.openstreetmap.org/{zoom}/{tx}/{ty}.png",
                headers={"User-Agent": "TokyoEVRange/1.0 (+https://www.higashisalary.com/)"},
            )
            with urlopen(request, timeout=20) as response:
                with Image.open(BytesIO(response.read())) as tile:
                    background.paste(tile.convert("RGBA"), (tx * 256 - left, ty * 256 - top))
    return background, (zoom, left, top), (x0 - left, y0 - top, x1 - left, y1 - top)


def save_map(roads, bounds, station, budget_km, output):
    name, origin = station
    background, (zoom, left, top), box = read_basemap(bounds)
    background = ImageEnhance.Color(background.convert("RGB")).enhance(0.20)
    background = Image.blend(background, Image.new("RGB", background.size, "white"), 0.30).convert("RGBA")
    x0, y0, x1, y1 = map(round, box)
    roads = roads.resize((x1 - x0, y1 - y0), Image.Resampling.LANCZOS)
    # Mute the base map and overlay the reachable roads at 85% opacity.
    roads.putalpha(roads.getchannel("A").point(lambda alpha: round(alpha * OVERLAY_OPACITY)))
    background.alpha_composite(roads, (x0, y0))

    sx, sy = world_pixel(*origin, zoom)
    sx, sy = round(sx - left), round(sy - top)
    draw = ImageDraw.Draw(background)
    draw.ellipse((sx - 8, sy - 8, sx + 8, sy + 8), fill="#153f72", outline="white", width=2)

    width, height = background.size
    result = Image.new("RGB", (width, height + 123), "#f5f8fa")
    result.paste(background, (0, 86))
    label = ImageDraw.Draw(result)
    font_path = Path("C:/Windows/Fonts/meiryo.ttc")
    use_system_font = font_path.is_file()
    def font(size):
        return ImageFont.truetype(str(font_path), size) if use_system_font else ImageFont.load_default(size)

    title = f"Reachable roads from {name}"
    legend = f"Blue dot: {name}   Purple lines: reachable major roads"
    label.text((18, 10), f"{title}  |  {budget_km:g} km", font=font(25), fill="#18354d")
    label.text((18, 48), f"60 kWh   /   SOC {SOC:.0%}   /   {CONSUMPTION_WH_PER_KM:g} Wh/km",
               font=font(16), fill="#37596b")
    label.text((12, height + 94), legend, font=font(13), fill="#18354d")
    label.text((width - 12, height + 94), "© OpenStreetMap contributors",
               font=font(13), fill="#18354d", anchor="ra")
    output.parent.mkdir(parents=True, exist_ok=True)
    result.save(output, format="PNG")

def main():
    parser = argparse.ArgumentParser(description=__doc__)
    parser.add_argument("pbf", type=Path, help="Geofabrik OSM PBF file for Japan")
    parser.add_argument("--station", choices=[*STATIONS, "both"], default="tokyo")
    parser.add_argument("--output", type=Path, help="Output file when one starting station is selected")
    args = parser.parse_args()
    if not args.pbf.is_file():
        parser.error(f"PBF file not found: {args.pbf}")
    if args.station == "both" and args.output:
        parser.error("Use --output only when one starting station is selected.")

    energy_wh = CAPACITY_KWH * 1000 * SOC
    budget_km = energy_wh / CONSUMPTION_WH_PER_KM
    limit_m = budget_km * 1000
    print(f"Available energy: {energy_wh:,.0f} Wh / Driving range: {budget_km:,.0f} km", flush=True)
    coords, vertices, ends, directions = read_roads(args.pbf)
    u, v, direction = get_segments(vertices, ends, directions)
    lengths = distance_m(coords[u], coords[v])
    print(f"Road graph: {len(coords):,} nodes, {len(u):,} edges", flush=True)
    graph = build_graph(coords, u, v, lengths, direction)
    for key in STATIONS if args.station == "both" else (args.station,):
        station = STATIONS[key]
        _, offset_m, distances = shortest_distances(graph, coords, station[1], limit_m)
        left, right, full, partial = reachable_segments(u, v, lengths, direction, distances, limit_m)
        print(f"{station[0]}: Road start {offset_m:.0f} m from station / {np.isfinite(distances).sum():,} reachable nodes / "
              f"{full.sum():,} full edges / {partial.sum():,} partial edges", flush=True)
        if not (full.any() or partial.any()):
            raise ValueError(f"No reachable roads found from {station[0]}.")
        image, bounds = draw_overlay(coords, u, v, ends, left, right, full, partial)
        output = args.output or Path(f"{key}_ev_range_en.png")
        save_map(image, bounds, station, budget_km, output)
        print(f"Saved map: {output.resolve()}", flush=True)


if __name__ == "__main__":
    main()
With Pillow, I first draw the reachable roads on a transparent image. I mute the colors of the base map and overlay the roads in purple at 85% opacity. That makes it easier to follow the roads while still being able to read the place names.
Comparing the range from Tokyo and Osaka Stations
Here’s what the generated images look like. The blue dot marks the starting station. The purple lines show the major roads you can reach within 40 km of driving.
Starting from Tokyo Station
Starting from Osaka Station
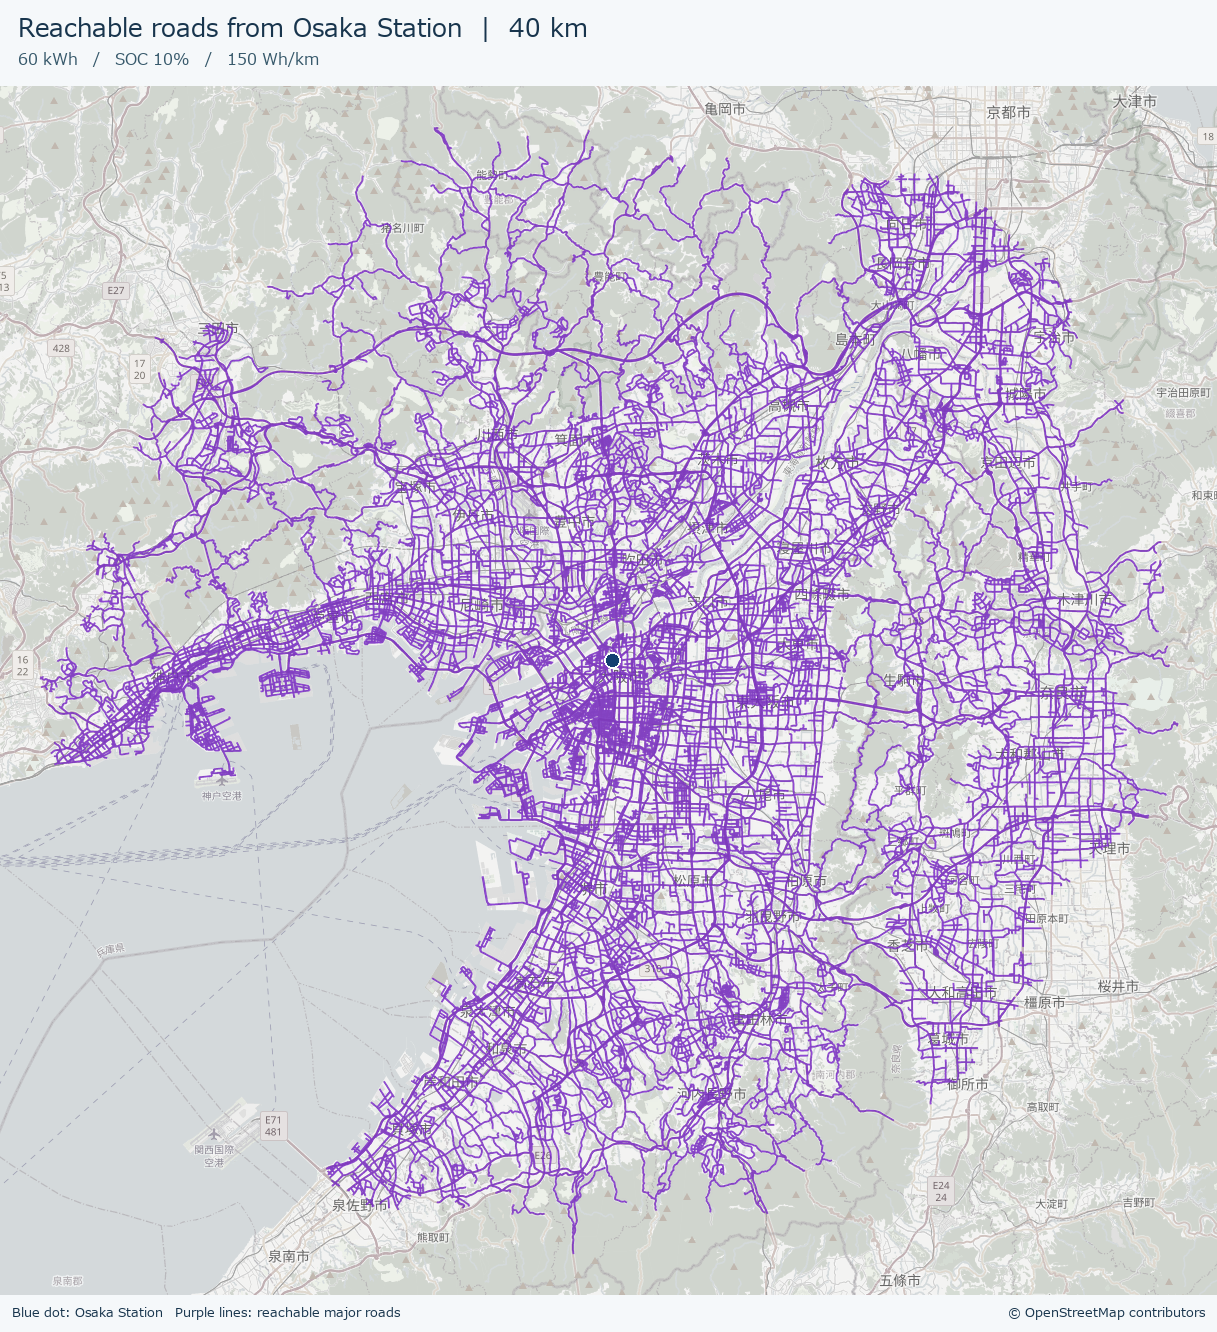
From Tokyo Station, the purple lines extend along the west and north sides of Tokyo Bay. From Osaka Station, they extend along Osaka Bay and to the northeast. The driving range is 40 km in both cases, but you can see how the road network changes where that distance will take you. I started the calculations at points on the road about 159 m from Tokyo Station and 117 m from Osaka Station.
Base map and road data: © OpenStreetMap contributors.
How long did it take?
In my Windows environment with Python 3.11, generating the Tokyo and Osaka maps together took 96.75 seconds (about 1 minute and 37 seconds) for both images.
I timed it from the moment the program started until it finished saving both PNGs. That includes reading the previously downloaded nationwide road data, calculating the reachable roads, fetching the base map, and composing and saving the images. The initial download of the nationwide road data is outside the timed run. This was a single run, so the time can vary with your computer and network connection.
Wrapping up
In this example, I took the remaining driving distance, calculated from the battery charge and average energy consumption, and turned it into a map of where you can go. Following the roads makes the same 40 km look quite different on a map.
This prototype leaves out narrow local streets, ferries, and turn restrictions at intersections. It also leaves out changes in energy consumption due to traffic or gradients, as well as any reserve for reaching a charger. The purple lines are drawn thicker so they’re easy to pick out on the map.
In the follow-up, How Does Energy Consumption Affect EV Range? Three Scenarios on a Map, I use this program to compare the roads you can reach at 120, 150, and 200 Wh/km. The battery charge is the same in each case, and the maps use the same scale so you can see how much the reachable area changes.
See you next time!


コメント