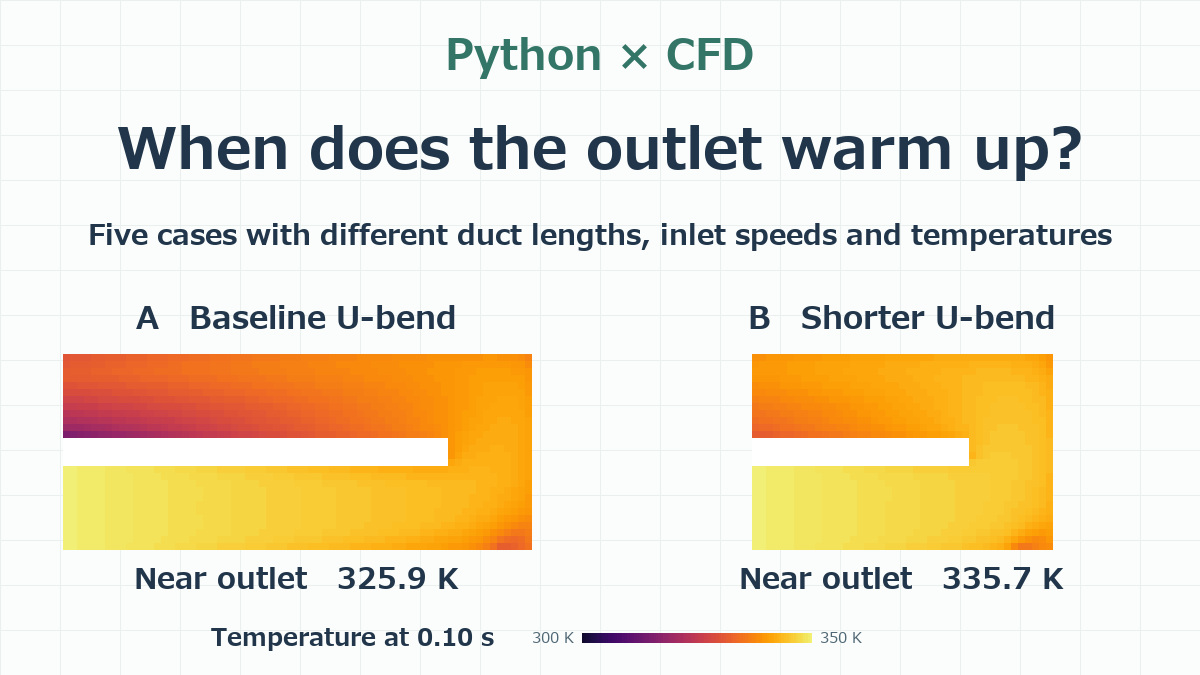
Hi, Higashi here.
In my last simulation, I heated the air entering a U-bend from 300 K to 350 K, then brought it back down to 300 K. By the time the inlet air started cooling, the air at the outlet was still warming up.
This time I used the same Python CFD solver to vary the length of the duct, the speed of the incoming air and its temperature. I ran five cases and lined them up so we can see what each duct looks like at the same instant. I covered the original setup and how the solver calculates temperature in the previous post on tracking a heat pulse through a U-bend.
What happens to the flow path if we move the bend 12 mm closer?
The duct has a square cross section, 6 mm on each side. In the animation, air enters at the lower left, turns around on the right and leaves at the upper left. For the shorter duct, I moved the bend 12 mm closer to the inlet. That takes 12 mm off each leg, so the distance along the centerline from inlet to outlet drops from 69 mm to 45 mm. Both ducts have the same inlet and outlet positions, the same cross section and two right-angle turns.
| Case | Path length | Peak inlet speed | Peak inlet temperature |
|---|---|---|---|
| A. Baseline | 69 mm | 2 m/s | 350 K |
| B. Shorter duct | 45 mm | 2 m/s | 350 K |
| C. Half the inlet speed | 69 mm | 1 m/s | 350 K |
| D. Half the inlet temperature rise | 69 mm | 2 m/s | 325 K |
| E. All three changes | 45 mm | 1 m/s | 325 K |
All five ducts start with still air at 300 K. Over the first 0.10 s, the inlet speed and temperature rise to the values in the table. Over the next 0.10 s, they fall back to 0 m/s and 300 K. Five cycles take exactly one second. The outlet is at atmospheric pressure, and the walls are insulated with a no-slip boundary condition. I used the same RNG k–ε turbulence model as before. Heat is carried by the airflow and spreads by diffusion. Air density and the other fluid properties stay constant.
With a grid spacing of 0.5 mm, the standard duct has 19,872 fluid cells and the shorter duct has 12,960. I used a time step of 0.00004 s and saved the flow and temperature fields every 0.01 s. With several cases running in parallel, each took between 1 min 30 s and 2 min 29 s, including mesh setup and saving the results. In all five cases, the heat that entered minus the heat that left matched the energy stored in the air inside the duct.
Air speed and temperature in the five cases
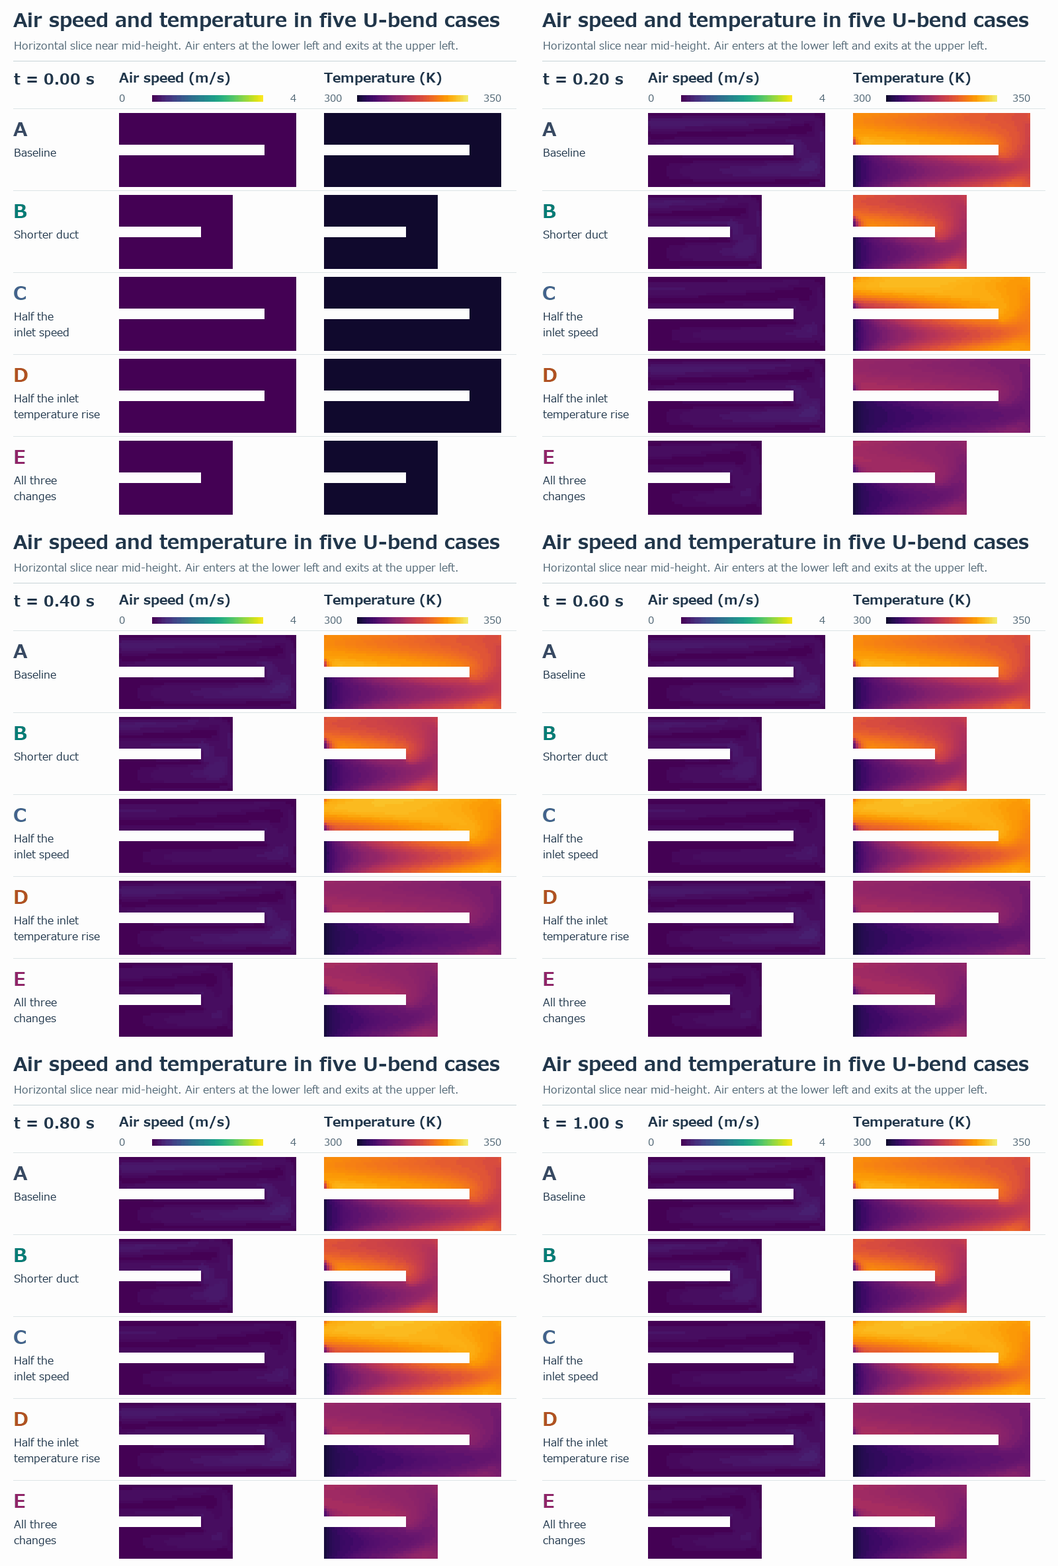
Compare the ducts at the same instant and you can see how much the warm-up pattern changes with the duct length and inlet conditions.
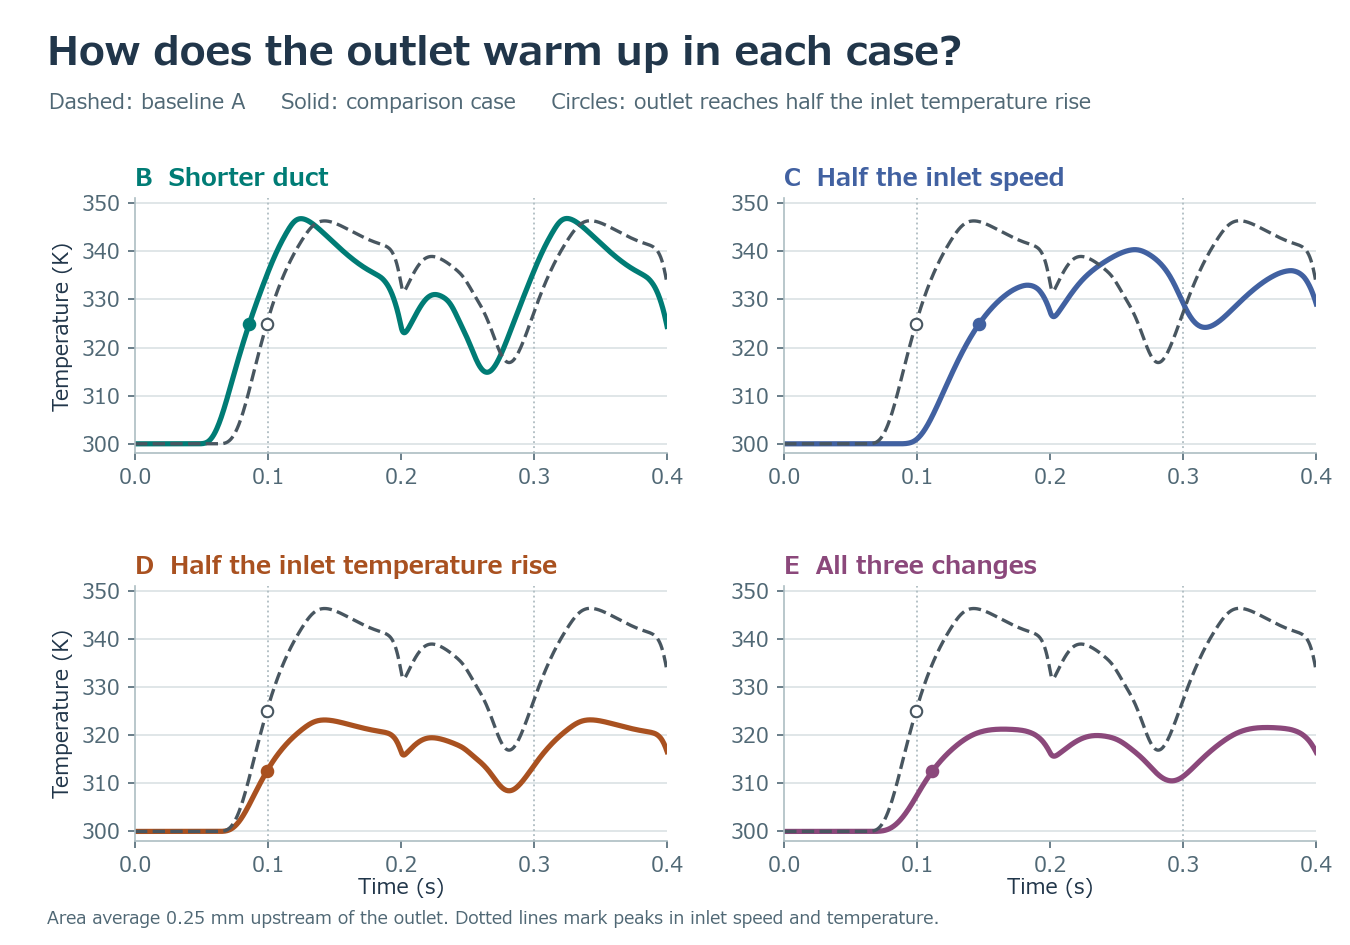
In the next post, I’ll use the results from these five simulations to build an AI model.
コメント