

こんにちは、ヒガシです。
電気自動車のナビに「あと何km走れるか」が表示されていても、その距離でどこまで行けるのかは、数字を見ただけでは意外と分かりづらいですよね。
たとえば東京駅で電池残量が10%だったとします。今の電費で走り続けたらどこまで行けるのか? 今回はこれを、PythonとOpenStreetMapの道路データを使って地図上に表示してみました。大阪駅でも同じ条件で計算して、結果を見比べています。
それではさっそくやっていきましょう!
あと何km走れるかを計算
今回の条件は以下のとおりです。
- 出発地点は東京駅と大阪駅(それぞれ別に計算)
- 電池容量は60 kWh
- 残SOC(電池残量の割合)は10%
- 平均電費は150 Wh/km
電費はこれまでの平均値を使う想定で、今回はどの道路でも150 Wh/kmで固定します。60 kWhの10%は6 kWhなので、Whに直して電費で割ると以下のようになります。
残りの電力量 = 60 × 1,000 × 0.10 = 6,000 Wh
航続距離 = 6,000 ÷ 150 = 40 km
150 Wh/kmは動作確認用に置いた値です。40 kmも、この条件で電池を使い切るまでの片道の計算値です。
道路に沿って走った距離を求める
東京駅を中心に半径40 kmの円を描くと、海の上まで入ってしまいます。そこで今回は、地図上の道路を小さな区間のつながりとして扱います。
OpenStreetMapでは、道路は複数の点をつないだ way として記録されています。点と点の間の距離を計算して、一方通行の場合は走れる向きにだけつなぎます。地図上で道路が交差して見えても、OpenStreetMap上で点を共有していなければ、片方の道路からもう片方へは移れません。
あとは、出発駅に近い道路上の点から、SciPyのダイクストラ法を使って各地点までの最短距離を求めます。たとえば、ある交差点までに39 km走ってきたなら、その先の道路が3 kmあっても最初の1 kmまでは走れます。サンプルでは、こういった道路も予算を使い切る地点まで描いています。
必要なライブラリと道路データ
今回はPython 3.11で動作を確認しました。必要なライブラリは以下の4つです。
- osmium(Pyosmium):OpenStreetMapのPBFファイルを読み込む
- NumPy:緯度・経度や道路の距離を配列で扱う
- SciPy:道路をつないだデータから最短距離を計算する
- Pillow:到達できる道路を背景地図に重ね、PNG画像にする
道路データはGeofabrikが配布している日本のOpenStreetMapデータを使いました。[Geofabrikの日本の道路データ]
サンプルコード
今回使ったPythonコードはこちらです。全国データから、高速道路・幹線道路などの主要道路と接続路を取り出しています。
Pythonコードを表示
"""東京駅・大阪駅から、電池残量で走れる主な道路を PNG の地図に描く。"""

import argparse
from array import array
from pathlib import Path
from io import BytesIO
from math import asinh, ceil, floor, log2, radians, tan
from urllib.request import Request, urlopen


import numpy as np
import osmium
from PIL import Image, ImageDraw, ImageEnhance, ImageFont
from scipy.sparse import csr_matrix
from scipy.sparse.csgraph import dijkstra


STATIONS = {
    "tokyo": ("東京駅", "Tokyo Station", (35.68126, 139.76671)),
    "osaka": ("大阪駅", "Osaka Station", (34.70221, 135.49557)),
}
CAPACITY_KWH = 60
SOC = 0.10
CONSUMPTION_WH_PER_KM = 150
EARTH_RADIUS_M = 6_371_008.8
OVERLAY_PIXELS = 6144
OVERLAY_STROKE_PX = 10
OVERLAY_OPACITY = 0.85
ROAD_COLOR = "#7327bd"
ROADS = {"motorway", "trunk", "primary", "secondary", "tertiary"}
ROADS |= {road + "_link" for road in ROADS}
NO_ACCESS = {"no", "private", "destination", "customers", "delivery"}


def distance_m(a, b):
    """緯度経度の組から、球面上の区間長をメートルで返す。"""
    lat1, lon1 = np.deg2rad(np.asarray(a).T)
    lat2, lon2 = np.deg2rad(np.asarray(b).T)
    h = np.sin((lat2 - lat1) / 2) ** 2
    h += np.cos(lat1) * np.cos(lat2) * np.sin((lon2 - lon1) / 2) ** 2
    return 2 * EARTH_RADIUS_M * np.arcsin(np.sqrt(np.clip(h, 0, 1)))


def driving_direction(tags):
    """0 は双方向、1 は OSM のノード順、-1 は逆方向。"""
    access = (tags.get("motorcar") or tags.get("motor_vehicle")
              or tags.get("vehicle") or tags.get("access"))
    if access in NO_ACCESS or tags.get("area") == "yes":
        return None

    one_way = (tags.get("oneway:motorcar") or tags.get("oneway:motor_vehicle")
               or tags.get("oneway"))
    if one_way == "-1":
        return -1
    if one_way in {"reversible", "alternating"}:
        return None
    if one_way in {"yes", "1", "true"}:
        return 1
    if one_way is None and (
        tags.get("highway") == "motorway"
        or tags.get("junction") in {"roundabout", "circular"}
    ):
        return 1
    return 0


def read_roads(pbf):
    """道路のノード列と方向を読み、必要なノードだけの座標を取得する。"""
    node_index = {}
    vertices = array("I")
    ends = array("I", [0])
    directions = array("b")
    ways = osmium.FileProcessor(pbf, osmium.osm.WAY).with_filter(
        osmium.filter.TagFilter(*[("highway", road) for road in sorted(ROADS)])
    )
    for way in ways:
        direction = driving_direction(way.tags)
        if direction is None or len(way.nodes) < 2:
            continue
        for node in way.nodes:
            vertices.append(node_index.setdefault(node.ref, len(node_index)))
        ends.append(len(vertices))
        directions.append(direction)

    if not node_index:
        raise ValueError("対象の道路がありません。日本の OSM PBF を指定してください。")

    coords = np.full((len(node_index), 2), np.nan)
    nodes = osmium.FileProcessor(pbf, osmium.osm.NODE).with_filter(
        osmium.filter.IdFilter(node_index.keys())
    )
    for node in nodes:
        if node.location.valid():
            coords[node_index[node.id]] = node.location.lat, node.location.lon

    return coords, np.asarray(vertices), np.asarray(ends), np.asarray(directions)


def get_segments(vertices, ends, directions):
    # way の末尾と次の way の先頭は、道路区間として扱わない。
    keep = np.ones(vertices.size - 1, dtype=bool)
    keep[ends[1:-1] - 1] = False
    return vertices[:-1][keep], vertices[1:][keep], np.repeat(
        directions, np.diff(ends) - 1
    )


def build_graph(coords, u, v, lengths, direction):
    node_count = len(coords)
    valid = np.isfinite(lengths) & (u != v)
    forward = valid & (direction >= 0)
    backward = valid & (direction <= 0)
    rows = np.concatenate((u[forward], v[backward])).astype(np.int64)
    cols = np.concatenate((v[forward], u[backward]))
    weights = np.concatenate((lengths[forward], lengths[backward]))

    # 同じノード対が複数の way に現れても、CSR の重複加算を避ける。
    _, indexes = np.unique(rows * node_count + cols, return_index=True)
    return csr_matrix(
        (np.maximum(weights[indexes], 0.001), (rows[indexes], cols[indexes])),
        shape=(node_count, node_count),
    )


def shortest_distances(graph, coords, origin, limit_m):
    station_offsets = distance_m(coords, origin)
    station_offsets[np.diff(graph.indptr) == 0] = np.inf
    if not np.any(np.isfinite(station_offsets)):
        raise ValueError("走行可能な道路の座標が見つかりません。")
    start = int(np.nanargmin(station_offsets))
    if station_offsets[start] > 2_000:
        raise ValueError("出発駅周辺の道路データが含まれていません。")
    distances = dijkstra(graph, directed=True, indices=start, limit=limit_m)
    return start, float(station_offsets[start]), distances


def reachable_segments(u, v, lengths, directions, distances, limit_m):
    """道路の両端から走れる割合と、全区間・一部到達のマスクを返す。"""
    with np.errstate(divide="ignore", invalid="ignore"):
        left = np.where(directions >= 0, (limit_m - distances[u]) / lengths, 0)
        right = np.where(directions <= 0, (limit_m - distances[v]) / lengths, 0)
    left = np.clip(left, 0, 1)
    right = np.clip(right, 0, 1)
    covered = np.isfinite(lengths) & (lengths > 0)
    full = covered & (left + right >= 1)
    partial = covered & ~full & ((left > 0) | (right > 0))

    return left, right, full, partial


def draw_overlay(coords, u, v, ends, left, right, full, partial):
    """到達区間を Web メルカトル投影の透明画像に描く。"""
    reach = full | partial
    endpoints = np.concatenate((coords[u[reach]], coords[v[reach]]))
    south, west = endpoints.min(axis=0) - 0.002
    north, east = endpoints.max(axis=0) + 0.002
    del endpoints

    def mercator_y(lat):
        return np.arcsinh(np.tan(np.deg2rad(lat)))

    ymin, ymax = mercator_y([south, north])
    x_span = np.deg2rad(east - west)
    y_span = ymax - ymin
    scale = (OVERLAY_PIXELS - 1) / max(x_span, y_span)
    width = int(np.ceil(x_span * scale)) + 1
    height = int(np.ceil(y_span * scale)) + 1
    pixels = np.zeros(coords.shape, dtype=np.int32)
    valid = np.isfinite(coords[:, 0])
    pixels[valid, 0] = np.rint((coords[valid, 1] - west) / (east - west) * (width - 1))
    pixels[valid, 1] = np.rint((ymax - mercator_y(coords[valid, 0])) / y_span * (height - 1))

    image = Image.new("RGBA", (width, height))
    draw = ImageDraw.Draw(image)
    color = ROAD_COLOR
    # 同じ way の連続区間をまとめ、重複描画でも色を濃くしない。
    offset = 0
    for count in np.diff(ends) - 1:
        stop = offset + int(count)
        run = []
        previous = offset - 1
        for i in np.flatnonzero(reach[offset:stop]) + offset:
            a, b = tuple(pixels[u[i]]), tuple(pixels[v[i]])
            if run and (i != previous + 1 or not full[i]):
                draw.line(run, fill=color, width=OVERLAY_STROKE_PX)
                run = []
            if full[i]:
                if not run:
                    run.append(a)
                run.append(b)
            else:
                if left[i] > 0:
                    draw.line([a, interpolate(a, b, left[i])], fill=color, width=OVERLAY_STROKE_PX)
                if right[i] > 0:
                    draw.line([interpolate(a, b, 1 - right[i]), b], fill=color, width=OVERLAY_STROKE_PX)
            previous = i
        if run:
            draw.line(run, fill=color, width=OVERLAY_STROKE_PX)
        offset = stop

    return image, [[south, west], [north, east]]


def interpolate(a, b, fraction):
    return tuple(round(x + fraction * (y - x)) for x, y in zip(a, b))


def world_pixel(lat, lon, zoom):
    """緯度経度を OpenStreetMap タイルのピクセル座標に変換する。"""
    size = 256 * 2 ** zoom
    return (lon + 180) / 360 * size, (1 - asinh(tan(radians(lat))) / np.pi) / 2 * size


def read_basemap(bounds):
    """出力画像に必要な範囲の背景タイルだけを結合する。"""
    (south, west), (north, east) = bounds
    a = world_pixel(north, west, 0)
    b = world_pixel(south, east, 0)
    span = max(b[0] - a[0], b[1] - a[1])
    zoom = min(16, max(0, floor(log2(1400 / span))))
    x0, y0 = world_pixel(north, west, zoom)
    x1, y1 = world_pixel(south, east, zoom)
    left, top, right, bottom = floor(x0) - 36, floor(y0) - 36, ceil(x1) + 36, ceil(y1) + 36
    background = Image.new("RGBA", (right - left, bottom - top))
    for ty in range(top // 256, (bottom - 1) // 256 + 1):
        for tx in range(left // 256, (right - 1) // 256 + 1):
            request = Request(
                f"https://tile.openstreetmap.org/{zoom}/{tx}/{ty}.png",
                headers={"User-Agent": "TokyoEVRange/1.0 (+https://www.higashisalary.com/)"},
            )
            with urlopen(request, timeout=20) as response:
                with Image.open(BytesIO(response.read())) as tile:
                    background.paste(tile.convert("RGBA"), (tx * 256 - left, ty * 256 - top))
    return background, (zoom, left, top), (x0 - left, y0 - top, x1 - left, y1 - top)


def save_map(roads, bounds, station, budget_km, output):
    name, english_name, origin = station
    background, (zoom, left, top), box = read_basemap(bounds)
    background = ImageEnhance.Color(background.convert("RGB")).enhance(0.20)
    background = Image.blend(background, Image.new("RGB", background.size, "white"), 0.30).convert("RGBA")
    x0, y0, x1, y1 = map(round, box)
    roads = roads.resize((x1 - x0, y1 - y0), Image.Resampling.LANCZOS)
    # 背景を淡くし、到達道路は不透明度85%で重ねる。
    roads.putalpha(roads.getchannel("A").point(lambda alpha: round(alpha * OVERLAY_OPACITY)))
    background.alpha_composite(roads, (x0, y0))

    sx, sy = world_pixel(*origin, zoom)
    sx, sy = round(sx - left), round(sy - top)
    draw = ImageDraw.Draw(background)
    draw.ellipse((sx - 8, sy - 8, sx + 8, sy + 8), fill="#153f72", outline="white", width=2)

    width, height = background.size
    result = Image.new("RGB", (width, height + 123), "#f5f8fa")
    result.paste(background, (0, 86))
    label = ImageDraw.Draw(result)
    font_path = Path("C:/Windows/Fonts/meiryo.ttc")
    japanese = font_path.is_file()
    def font(size):
        return ImageFont.truetype(str(font_path), size) if japanese else ImageFont.load_default(size)

    title = f"{name}からの到達可能範囲" if japanese else f"Roads reachable from {english_name}"
    legend = f"青丸:{name}    紫:到達可能な主要道路" if japanese else f"Blue: {english_name}   Purple: reachable major roads"
    label.text((18, 10), f"{title}  |  {budget_km:g} km", font=font(25), fill="#18354d")
    label.text((18, 48), f"60 kWh   /   SOC {SOC:.0%}   /   {CONSUMPTION_WH_PER_KM:g} Wh/km",
               font=font(16), fill="#37596b")
    label.text((12, height + 94), legend, font=font(13), fill="#18354d")
    label.text((width - 12, height + 94), "© OpenStreetMap contributors",
               font=font(13), fill="#18354d", anchor="ra")
    output.parent.mkdir(parents=True, exist_ok=True)
    result.save(output, format="PNG")

def main():
    parser = argparse.ArgumentParser(description=__doc__)
    parser.add_argument("pbf", type=Path, help="Geofabrik の日本 OSM PBF")
    parser.add_argument("--station", choices=[*STATIONS, "both"], default="tokyo")
    parser.add_argument("--output", type=Path, help="単一の出発駅を指定したときの出力ファイル")
    args = parser.parse_args()
    if not args.pbf.is_file():
        parser.error(f"PBF ファイルが見つかりません: {args.pbf}")
    if args.station == "both" and args.output:
        parser.error("--output は出発駅を1つ指定した場合に使えます。")

    energy_wh = CAPACITY_KWH * 1000 * SOC
    budget_km = energy_wh / CONSUMPTION_WH_PER_KM
    limit_m = budget_km * 1000
    print(f"利用可能な電力量: {energy_wh:,.0f} Wh / 走行距離: {budget_km:,.0f} km", flush=True)
    coords, vertices, ends, directions = read_roads(args.pbf)
    u, v, direction = get_segments(vertices, ends, directions)
    lengths = distance_m(coords[u], coords[v])
    print(f"グラフ: {len(coords):,} ノード、{len(u):,} 区間", flush=True)
    graph = build_graph(coords, u, v, lengths, direction)
    for key in STATIONS if args.station == "both" else (args.station,):
        station = STATIONS[key]
        _, offset_m, distances = shortest_distances(graph, coords, station[2], limit_m)
        left, right, full, partial = reachable_segments(u, v, lengths, direction, distances, limit_m)
        print(f"{station[0]}: 始点まで {offset_m:.0f} m / 到達 {np.isfinite(distances).sum():,} ノード / "
              f"全区間 {full.sum():,} / 一部 {partial.sum():,}", flush=True)
        if not (full.any() or partial.any()):
            raise ValueError(f"{station[0]}から到達可能な道路が見つかりません。")
        image, bounds = draw_overlay(coords, u, v, ends, left, right, full, partial)
        output = args.output or Path(f"{key}_ev_range.png")
        save_map(image, bounds, station, budget_km, output)
        print(f"地図を保存しました: {output.resolve()}", flush=True)


if __name__ == "__main__":
    main()
Pillowでは、走れる道路だけを透明な画像に描きます。背景の色を薄くし、その上に不透明度85%の紫の線を重ねました。地名を残しながら、走れる道路を目で追いやすくしています。
東京駅と大阪駅からの到達範囲を比べてみる
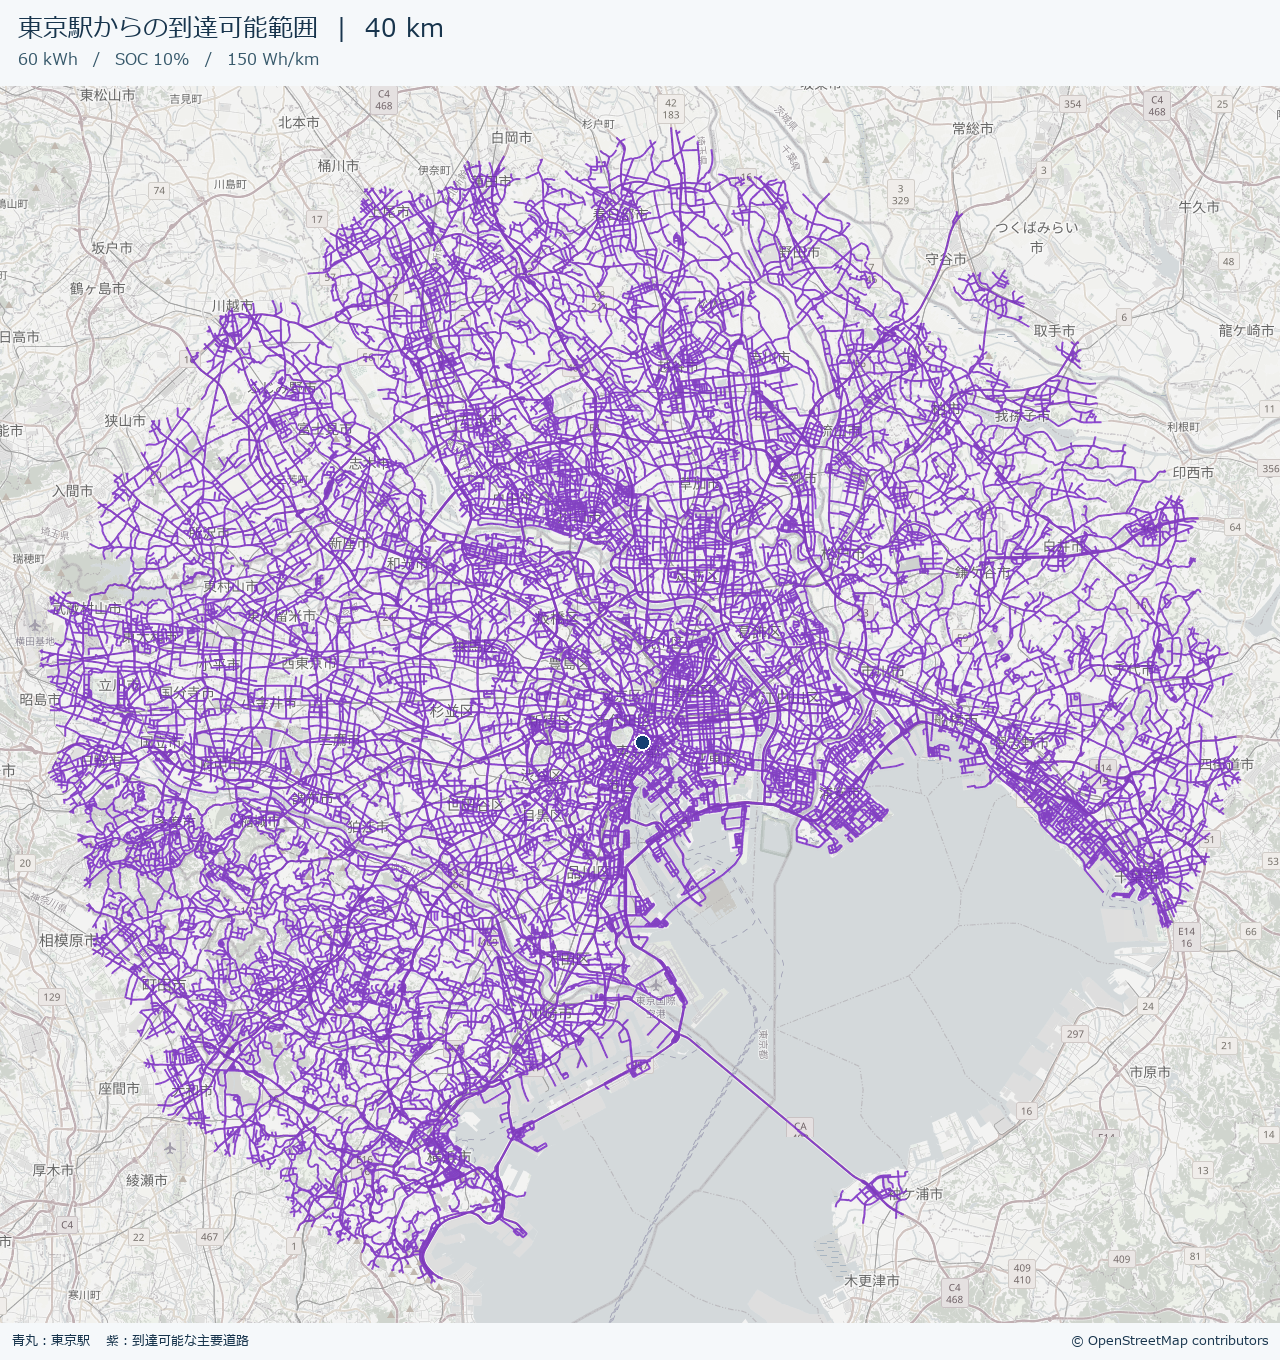
では、実際に出力した画像を見てみましょう。青い丸が出発駅で、紫の線が道路に沿って40 km以内で走れる主要道路です。
東京駅を出発した場合
大阪駅を出発した場合
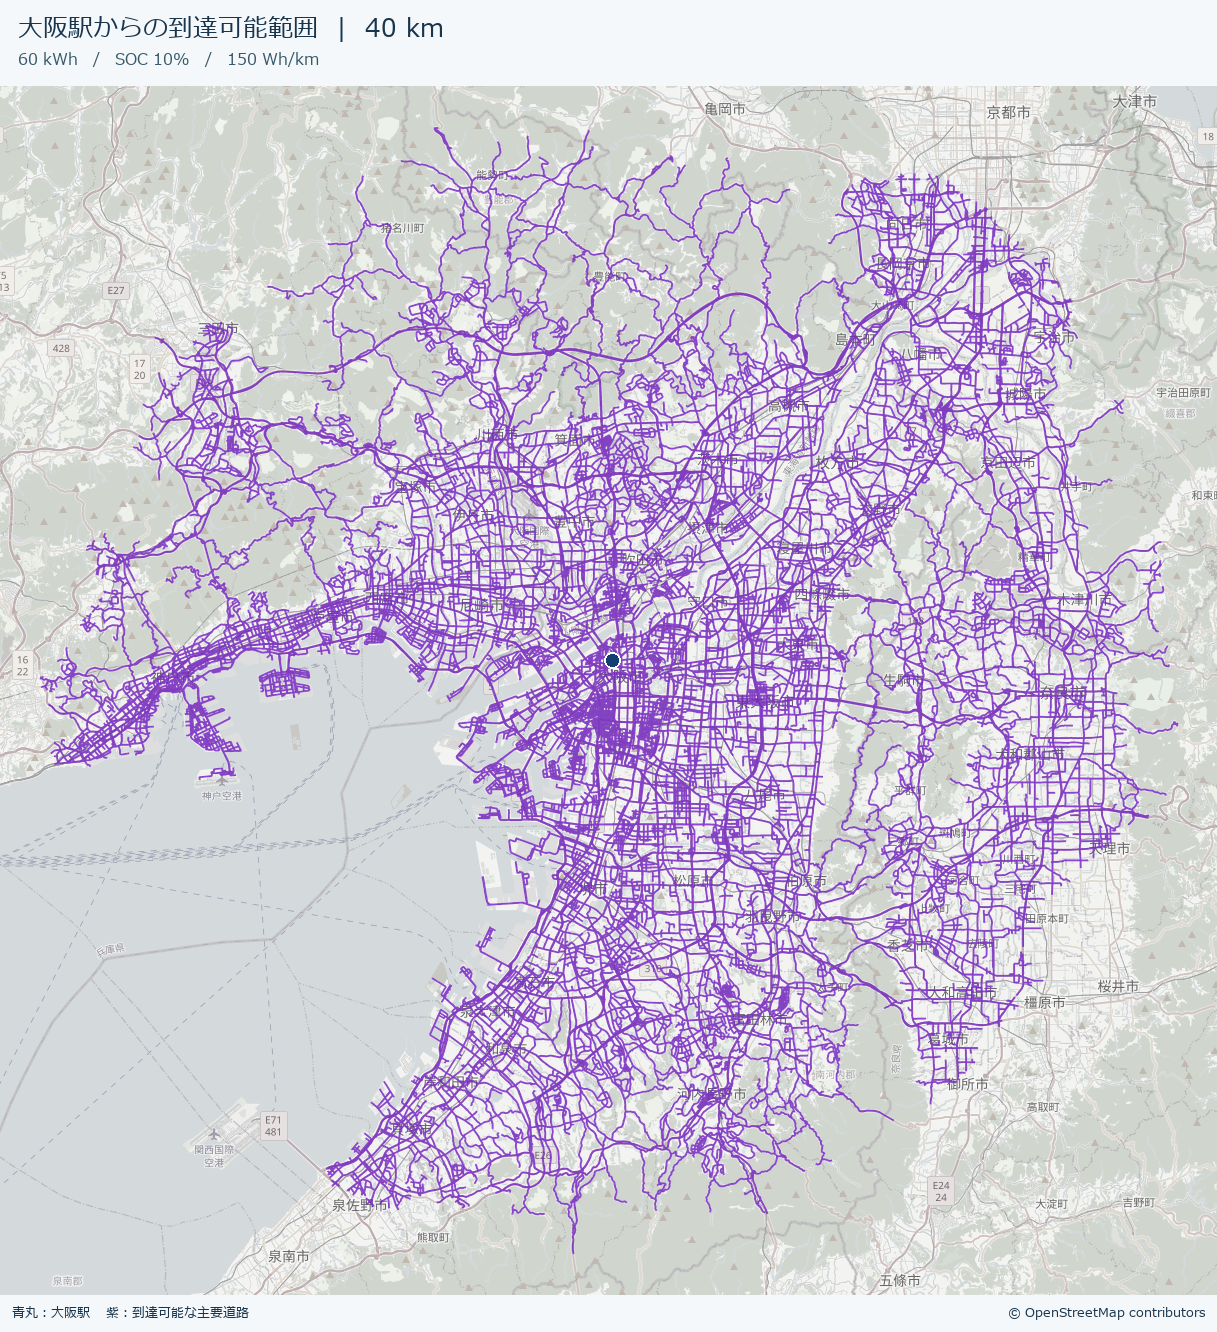
東京駅からは東京湾の西側や北側、大阪駅からは大阪湾沿いと北東方向にも紫の線が伸びています。走れる距離はどちらも40 kmですが、道路のつながり方で広がり方が変わるのが分かりますね。計算の始点には、東京駅から約159 m、大阪駅から約117 m離れた道路上の点を使いました。
背景地図と道路データの出典は © OpenStreetMap contributors です。
実行にかかった時間
ちなみに、今回のWindows環境(Python 3.11)で東京駅と大阪駅の地図をまとめて作ってみたところ、2枚で96.75秒(約1分37秒)かかりました。
計ったのはプログラムを起動してから、両方のPNGを保存し終えるまでです。保存済みの全国道路データの読み込み、到達範囲の計算、背景地図の取得、画像の合成と保存を含みます。全国道路データを最初にダウンロードする時間は含めていません。1回の実測なので、PCや通信環境によって前後します。
若干長いので、このあたりはもう少し改善したいですね。
おわりに
今回は、電池残量と平均電費から求めた「あと何km」を、「地図で見るとどこまで行けるか」に変えてみました。道路に沿って計算すると、同じ40 kmでも、地図の上で見たときの印象がだいぶ変わります。
今回の試作では細い生活道路やフェリー、交差点ごとの右左折規制は扱っていません。渋滞や勾配による電費の変化、充電のための余裕も計算外です。紫の線は地図上で見分けやすいように太めに描いています。
続編「EVの航続範囲は電費でどう変わる?3条件を地図で比較」では、今回のプログラムを使って、電費を120・150・200 Wh/kmに変えたときの到達範囲を比べます。電池残量が同じでも行ける場所がどれくらい変わるのか、同じ縮尺の地図に並べてみました。
それではまた!


コメント